Today, I want to share with you an important aspect of Linux system administration that has always intrigued me. As an ardent Linux lover, I have spent countless hours diving into the world of system logs. This might seem a tad bit nerdy, but trust me, it’s like being Sherlock Holmes, but in the Linux universe. Nothing beats the feeling of understanding a log file’s entrails and fixing an error that has been giving you sleepless nights.
However, I’ll admit it’s not always a walk in the park. There are times when logs have left me more confused than ever before, seemingly endless text lines forming a labyrinth. But, and this is a big ‘but’, there are tools and methods to simplify this process, making it not just easier, but also real-time. Yes, you read that right: real-time monitoring of Linux log files! Today, I’ll be sharing my favorite ways to do so, with some practical examples and tips thrown into the mix.
5 ways to monitor Linux log files in real time
1. Using the ‘tail -f’ command
If you’re familiar with Linux, you’re likely to have crossed paths with the ‘tail’ command. Tail, in my opinion, is a deceptively simple yet powerful tool that shows you the last part of files. By adding the ‘-f’ (stands for “follow”) switch, you get a real-time feed of the file.
For instance, if you want to monitor the syslog file in real time, you’d type:
tail -f /var/log/syslog
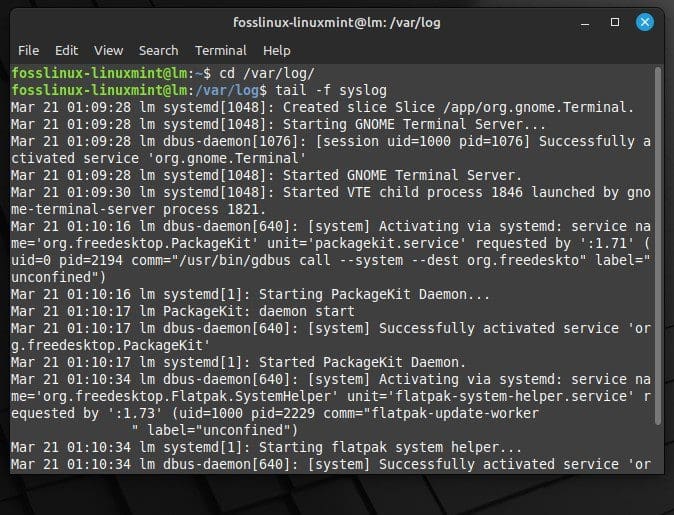
Viewing the contents of syslog file with tail
Every time a new entry is added to this file, it’ll be displayed on your screen, just like a live stream. While I appreciate ‘tail -f’ for its simplicity and directness, sometimes, it can get a bit overwhelming, especially with logs that are updated very frequently.
Troubleshooting Tip:
If you are getting a “permission denied” error while trying to access a log file, use the ‘sudo’ command, as most log files require superuser privileges. The command will be:
sudo tail -f /var/log/syslog
Pro Tip:
To monitor multiple files at once, you can use this command:
tail -f /var/log/syslog /var/log/auth.log
2. Using multitail
Sometimes, it’s necessary to monitor multiple log files simultaneously. This is where ‘multitail’ comes in handy. It’s an enhancement of the ‘tail -f’ command and lets you monitor several log files in separate windows, all within the same terminal screen.
Let’s say you want to monitor the ‘syslog’ and ‘auth.log’ files simultaneously. You would use:
multitail /var/log/syslog /var/log/auth.log
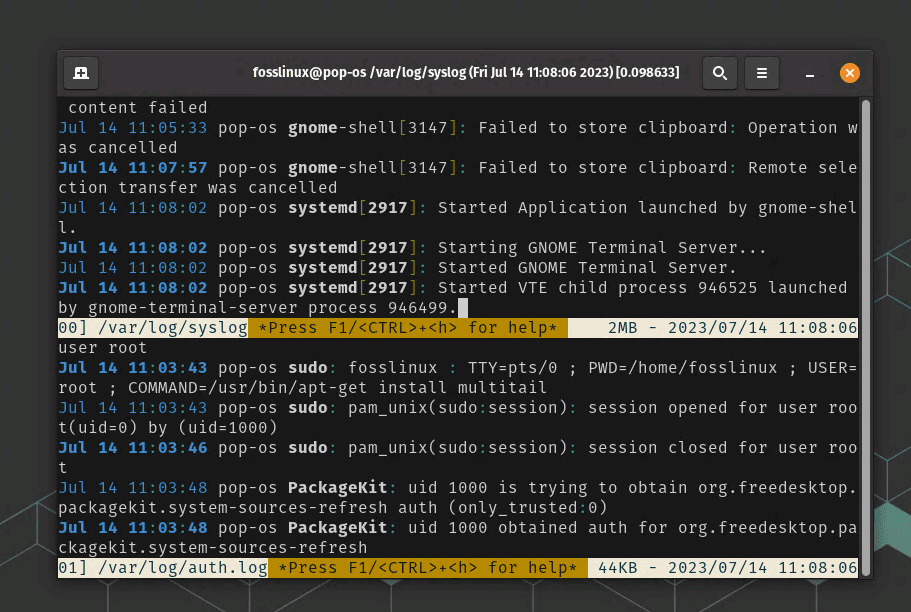
Running multitail command on Pop!_OS
It feels like having multiple eyes watching different parts of your system, doesn’t it? But there’s also a downside: multitail might not be available in all distributions by default, and you may need to install it manually. The process of installing ‘multitail’ on a Linux system depemulnds on the distribution of Linux that you’re using. Here, I’ll cover the installation process for a few popular Linux distributions.
Ubuntu / Debian
If you’re using Ubuntu or Debian, you can install ‘multitail’ using the apt-get package manager. You would run the following command in the terminal:
sudo apt-get update
sudo apt-get install multitail
Fedora
On a Fedora system, you can install ‘multitail’ with the dnf package manager. You would use this command:
sudo dnf install multitail
CentOS
If you’re on a CentOS system, you can use the yum package manager to install ‘multitail’. Here’s how:
sudo yum install multitail
Arch Linux
For Arch Linux users, ‘multitail’ is available from the community repository. You can install it using the pacman package manager with this command:
sudo pacman -Sy multitail
Remember to replace sudo with su -c if your system does not have sudo configured.
After installation, you can check whether ‘multitail’ has been installed correctly by typing multitail into the terminal. If it’s installed correctly, you’ll be presented with a new blank window or a usage help text.
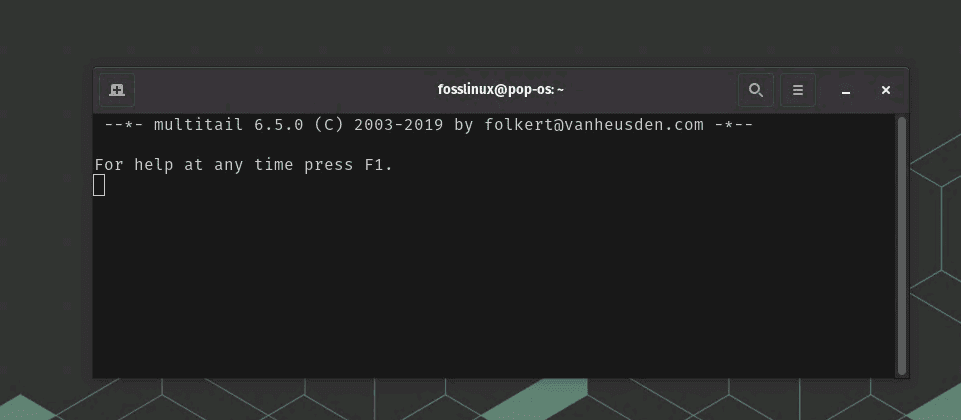
Multitail installed on Pop!_OS
Tip: To exit a window in multitail, press ‘q’. To quit multitail altogether, press ‘Q’.
3. Using ‘less +F’ command
One of the less known tricks (pun intended) is to use the ‘less’ command with ‘+F’ option. This command gives you a view similar to ‘tail -f’ but with the ability to navigate through the file.
Use the command like this:
less +F /var/log/syslog
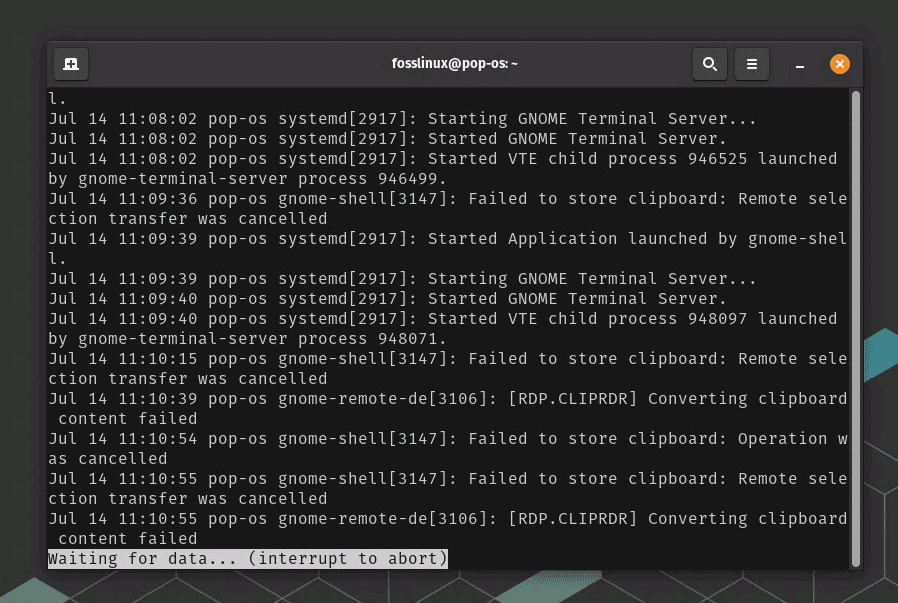
Using ‘less +F’ command
Press ‘Ctrl+C’ to stop the real-time feed and navigate. Press ‘Shift+F’ to resume it. This is an excellent command, particularly when you want to sift through the log file and observe real-time changes. The flip side? It’s not as intuitive as the other commands.
Troubleshooting Tip:
If you can’t navigate after pressing ‘Ctrl+C’, ensure you are not in Caps Lock mode.
Pro Tip:
Press ‘/’ followed by a keyword to search within the file. To navigate to the next instance of the keyword, press ‘n’.
4. Using logwatch
Logwatch is a powerful log analyzer and reporter, a pearl in the sea of log monitoring tools. It goes beyond real-time monitoring to provide a detailed analysis of the system’s logs. It can be configured to send daily reports to the system administrator.
Here’s how you can do it on a few popular distributions.
Ubuntu / Debian
If you’re on an Ubuntu or Debian system, use the ‘apt-get’ package manager to install ‘logwatch’. The commands are:
sudo apt-get update
sudo apt-get install logwatch
Fedora
On Fedora, you can use the ‘dnf’ package manager to install ‘logwatch’. Here’s the command:
sudo dnf install logwatch
CentOS
For CentOS users, the ‘yum’ package manager is used to install ‘logwatch’. You would use:
sudo yum install logwatch
Arch Linux
For Arch Linux users, ‘logwatch’ can be installed from the AUR (Arch User Repository) with the ‘yay’ or ‘paru’ helper. Here’s the command for ‘yay’:
yay -S logwatch
Again, remember to replace ‘sudo’ with ‘su -c’ if your system does not have sudo configured. After installation, you can confirm that ‘logwatch’ is installed correctly by typing ‘logwatch’ into the terminal. If it’s installed correctly, it will generate a summary of the system’s activities.
And to generate a report:
sudo logwatch
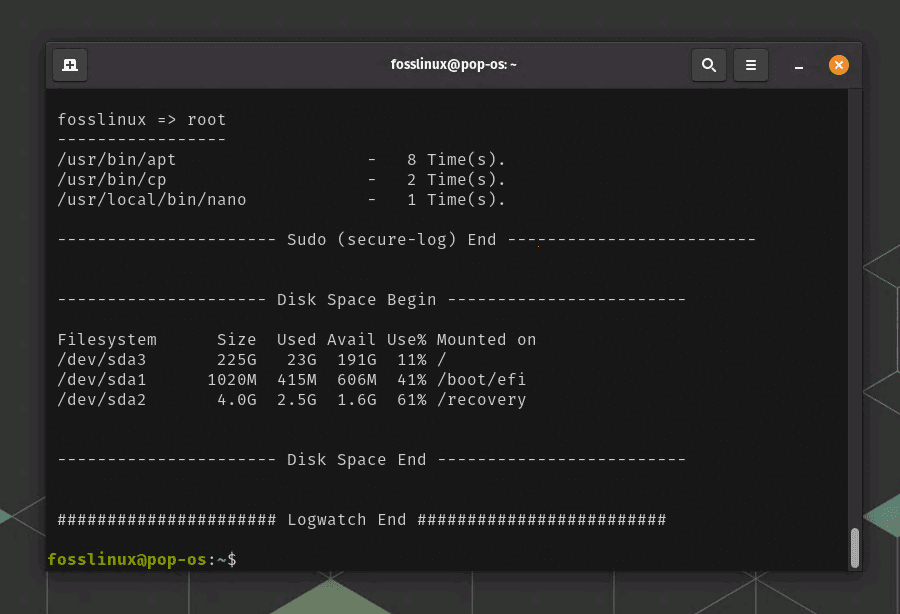
Running logwatch report on Pop!_OS
Logwatch is excellent for a comprehensive analysis, but its complexity can be a bit daunting for new users.
Troubleshooting Tip:
If the logwatch command is not recognized, ensure it’s installed correctly and the necessary path is added to the PATH environment variable.
Pro Tip:
You can customize the report by specifying a range of options. For instance, to get a report for a specific date, you can use:
sudo logwatch --range "2019-09-07"
5. Using lnav
Last on my list, but certainly not least, is the Log File Navigator, or lnav. Lnav provides a more interactive experience, with a rich feature set including automatic log file discovery, syntax highlighting, and even SQL queries to analyze logs.
Here’s how you can install ‘lnav’ on some popular Linux distributions.
Ubuntu / Debian
On Ubuntu or Debian, you can use the ‘apt-get’ package manager to install ‘lnav’. You’d run the following commands in the terminal:
sudo apt-get update
sudo apt-get install lnav
Fedora
On Fedora, you can install ‘lnav’ using the ‘dnf’ package manager with the following command:
sudo dnf install lnav
CentOS
CentOS users can use the ‘yum’ package manager to install ‘lnav’. Here’s how:
sudo yum install lnav
However, please note that ‘lnav’ might not be directly available from the default CentOS repositories. If that’s the case, you might need to enable the EPEL (Extra Packages for Enterprise Linux) repository first:
sudo yum install epel-release
Arch Linux
For Arch Linux users, ‘lnav’ can be installed from the AUR (Arch User Repository) using an AUR helper like ‘yay’ or ‘paru’. Here’s how to install it using ‘yay’:
yay -S lnav
To monitor a log file in real time:
lnav /var/log/syslog
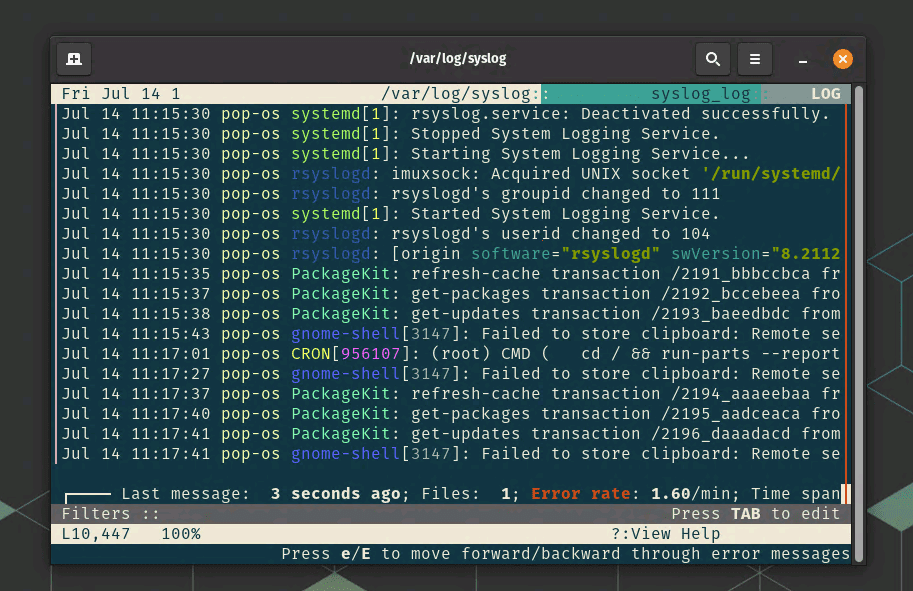
Using lnav to monitor syslog
While lnav is a feature-rich tool, some might find it overkill for simple tasks. Also, it might not be available in all distributions by default.
Troubleshooting Tip:
If lnav is not recognizing a log format, make sure it’s supported by referring to lnav’s documentation.
Pro Tip:
Lnav supports advanced searching. Press ‘/’ to start a search, and ‘n’ to navigate to the next match.
Conclusion
To sum up, Linux log monitoring can be a daunting task, but with the right tools, you can make it a walk in the park. The methods mentioned above have their pros and cons, and the choice depends largely on your needs and your system. Personally, I am a big fan of ‘tail -f’ for its simplicity, and ‘lnav’ for when I need more advanced features. ‘Multitail’ comes in handy when I’m feeling extra vigilant and need to monitor multiple logs.
Logs are your friends. They hold the key to understanding the intricacies of your Linux system and, at times, they can be your only lead when troubleshooting problems. So, roll up your sleeves and don your detective cap, because in the world of Linux, you’re the Sherlock Holmes!
I hope this article has been helpful, especially for the budding Linux enthusiasts out there. In my next blog, I plan to dive into some more advanced topics. Until then, keep exploring, keep learning, and remember, the only limit is your curiosity!

