If there’s one thing I’ve come to cherish in my Linux journey, it’s the sheer power and flexibility it offers. But, just like in any epic tale, every hero has a vulnerability. For our beloved Linux systems, the unseen adversary is often overheating. Ignoring this silent foe can lead to a slew of complications, from unexpected shutdowns to a shortened system lifespan. So, buckle up as we embark on a journey to master the art of monitoring CPU temperatures in Linux, ensuring our machines run as cool as our passion for them.
Checking the CPU temperature in Linux
In this guide, we’ll delve into various commands to monitor CPU temperature on your Linux machine, ensuring you never get into hot water with unexpected shutdowns or reduced performance.
1. Why monitoring CPU temperature is important
Before jumping into the commands, let’s understand why it’s vital to monitor the CPU temperature. Heat can be a silent killer for computers. Overheating can lead to:
- Reduced lifespan of the CPU.
- Unexpected shutdowns.
- Performance throttling.
- Damage to other components.
Alright, now that we’ve established the significance of this topic, let’s dive into the fun part – the commands!
2. Checking for hardware monitoring support: sensors-detect
Before we can proceed to read the temperature, we should check if our Linux machine supports hardware monitoring. For this, we use the sensors-detect command. It is not included in most Linux distributions, but you can quickly install it using the following commands.
If you are using a Red Hat-based distribution (such as CentOS or Fedora)
yum search lm-sensors
If you are using a Debian-based distribution:
sudo apt install lm-sensors
If you are using a Red Hat-based distribution:
sudo yum install lm-sensors
Syntax:
sudo sensors-detect
Sample Output:
# sensors-detect version 3.5.0
[...]
Driver `coretemp':
  * Chip `Intel digital thermal sensor' (confidence: 9)
[...]
Once you run it, follow the prompts. By the end, it will suggest which kernel modules you should load to read the sensors. In my experience, this is a fairly straightforward step, but the one time I got too overconfident and skipped it, I regretted it. Lesson learned!
3. Reading the temperature: sensors
Once you’ve installed lm-sensors from section #2, it should detect the necessary sensors, and you can proceed to read the temperature using the sensors command.
Syntax:
sensors
Sample Output:
coretemp-isa-0000
Adapter: ISA adapter
Package id 0:  +40.0°C  (high = +80.0°C, crit = +100.0°C)
Core 0:        +38.0°C  (high = +80.0°C, crit = +100.0°C)
Core 1:        +39.0°C  (high = +80.0°C, crit = +100.0°C)
This command provides a quick and easy-to-read summary of your CPU temperature. I must admit, there’s a certain satisfaction I get from glancing at these numbers and knowing everything’s running cool and smoothly.
4. Peeking at processor information: cat /proc/cpuinfo
While not strictly about temperature, understanding your processor can give context to your temperature readings.
Syntax:
cat /proc/cpuinfo
Sample Output:
processor   : 0
vendor_id   : GenuineIntel
cpu family  : 6
model       : 142
model name  : Intel(R) Core(TM) i5-8250U CPU @ 1.60GHz
[...]
Honestly, it’s like getting to know a friend better. Knowing your processor’s details gives you insight into its capabilities and thresholds.
5. Using watch to monitor in real-time
One of my personal favorites! If you want to monitor the temperature continuously, combine sensors with watch.
Syntax:
watch sensors
The command will keep refreshing and displaying the output of the sensors command. It feels almost like you’ve got a live health monitor running for your CPU. It’s oddly mesmerizing – or maybe that’s just my geeky side talking!
6. If you’re a graph person: psensor
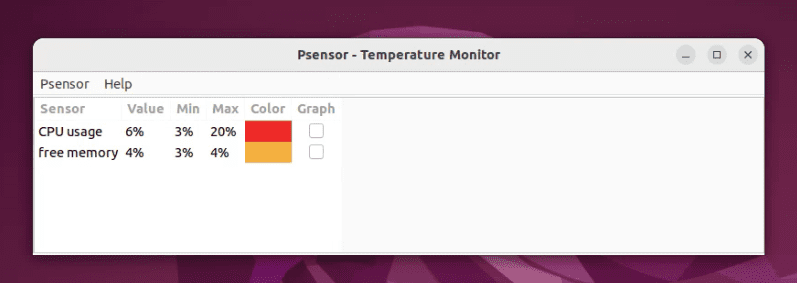
For those who love visuals, psensor is a graphical hardware temperature monitor for Linux. You might need to install it first:
Syntax for installation:
sudo apt-get install psensor
Once installed, run psensor, and you’ll be greeted with a lovely graphical representation of temperatures. I’ve wasted more time than I’d like to admit admiring those graphs!

Running Psensor on ubuntu
FAQ: Keeping your CPU cool and your questions answered
While monitoring CPU temperature might seem straightforward, several questions often arise, especially for Linux newbies (welcome aboard!). Here’s a curated list of some frequently asked questions:
Q1. Why is my CPU temperature high?
Answer: Several factors can cause high CPU temperatures:
- Dust and Debris: Over time, dust can accumulate inside your computer, blocking airflow and leading to increased temperatures.
- Thermal Paste: The thermal paste between the CPU and the heatsink might be old or not applied correctly.
- High Workload: Running heavy tasks, such as video editing or gaming, can elevate the temperature.
- Ambient Temperature: If your room is hot, it will naturally make cooling the CPU harder.
Q2. What’s a “safe” temperature for my CPU?
Answer: While it can vary based on the specific CPU model, a general rule of thumb is:
- Idle: 30°C – 50°C
- Under Load: 60°C – 80°C
Exceeding 90°C is generally considered dangerous and might lead to throttling or hardware damage.
Q3. How can I cool down my CPU?
Answer: Some common solutions include:
- Cleaning: Regularly clean the inside of your computer to remove dust.
- Better Airflow: Ensure your PC has adequate airflow. Sometimes simply rearranging the setup can help.
- Upgrading Cooling System: Consider investing in a better cooling solution, like a more efficient fan or even liquid cooling.
- External Environment: Keep your room cool and ensure that the computer’s vents aren’t blocked.
Q4. How often should I check my CPU temperature?
Answer: It’s a good habit to check when you:
- Install a New Application/Game: This can push your CPU, so it’s wise to monitor the temperature.
- Feel Performance Issues: If your computer starts lagging or behaving erratically, it could be due to overheating.
- Periodic Checks: Even if everything feels fine, a monthly check can help you spot potential issues early.
Q5. Can software updates affect my CPU temperature?
Answer: Yes, they can. Sometimes a software update, especially at the OS level, might contain bugs that cause high CPU utilization, leading to increased temperatures. Always keep an eye on system performance post any major updates.
Q6. Can I set alerts for high CPU temperature?
Answer: Absolutely! Tools like psensor provide options to set alerts when the temperature crosses a certain threshold. It’s a proactive way to ensure your CPU’s health.
Conclusion
Throughout our discussion, we have explored the intricacies of monitoring CPU temperatures in Linux while emphasizing its crucial role in ensuring hardware longevity and optimal performance. Starting with the importance of temperature checks, we delved into various commands, from sensors-detect to the visually appealing psensor. We also explored the world of real-time monitoring using watch and enriched our understanding with a comprehensive FAQ section. Monitoring CPU temperature is not just a technical task but also about safeguarding your system’s health, ensuring efficiency, and enjoying peace of mind in the Linux ecosystem. Stay informed, stay proactive, and most importantly, keep those CPUs cool!

