Wazuh is a free, open-source, and enterprise-ready security monitoring solution for threat detection, integrity monitoring, incident response, and compliance.
In this tutorial, we are going to show Distributed architecture installation. The distributed architectures control the Wazuh manager and elastic stack clusters via different hosts. Wazuh manager and Elastic Stack are managed on the same platform by single-host implementations.
Wazuh server: Runs the API and Wazuh Manager. The data from deployed agents are collected and analyzed.
Elastic Stack: Runs Elasticsearch, Filebeat, and Kibana (including Wazuh). It reads, parses, indexes, and stores Wazuh manager alert data.
Wazuh agent: Runs on the host monitored, collecting log and configuration data, and detecting intrusions and anomalies.
1. Installing Wazuh Server
Pre-setup
Let’s set the hostname first. Launch Terminal and enter the following command:
hostnamectl set-hostname wazuh-server
Update CentOS and packages:
yum update -y
Next, install NTP and check its service status.
yum install ntp
systemctl status ntpd
If the service is not started, start it using below command:
systemctl start ntpd
Enable NTP on system boot:
systemctl enable ntpd
Modify firewall rules to allow NTP service. Run the following commands to enable service.
firewall-cmd --add-service=ntp --zone=public --permanent
firewall-cmd --reload
Installing Wazuh Manager
Let’s add key:
rpm --import https://packages.wazuh.com/key/GPG-KEY-WAZUH
Edit the Wazuh repository:
vim /etc/yum.repos.d/wazuh.repo
Add the following content to the file.
[wazuh_repo]
gpgcheck=1
gpgkey=https://packages.wazuh.com/key/GPG-KEY-WAZUH
enabled=1
name=Wazuh repository
baseurl=https://packages.wazuh.com/3.x/yum/
protect=1
Save and exit the file.
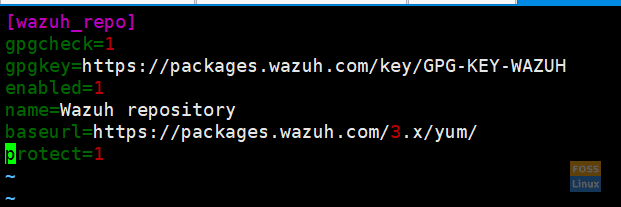
Repository Wazuh Server
List the repositories using the repolist command.
yum repolist

List Repositories
Install the Wazuh manager using the below command:
yum install wazuh-manager -y
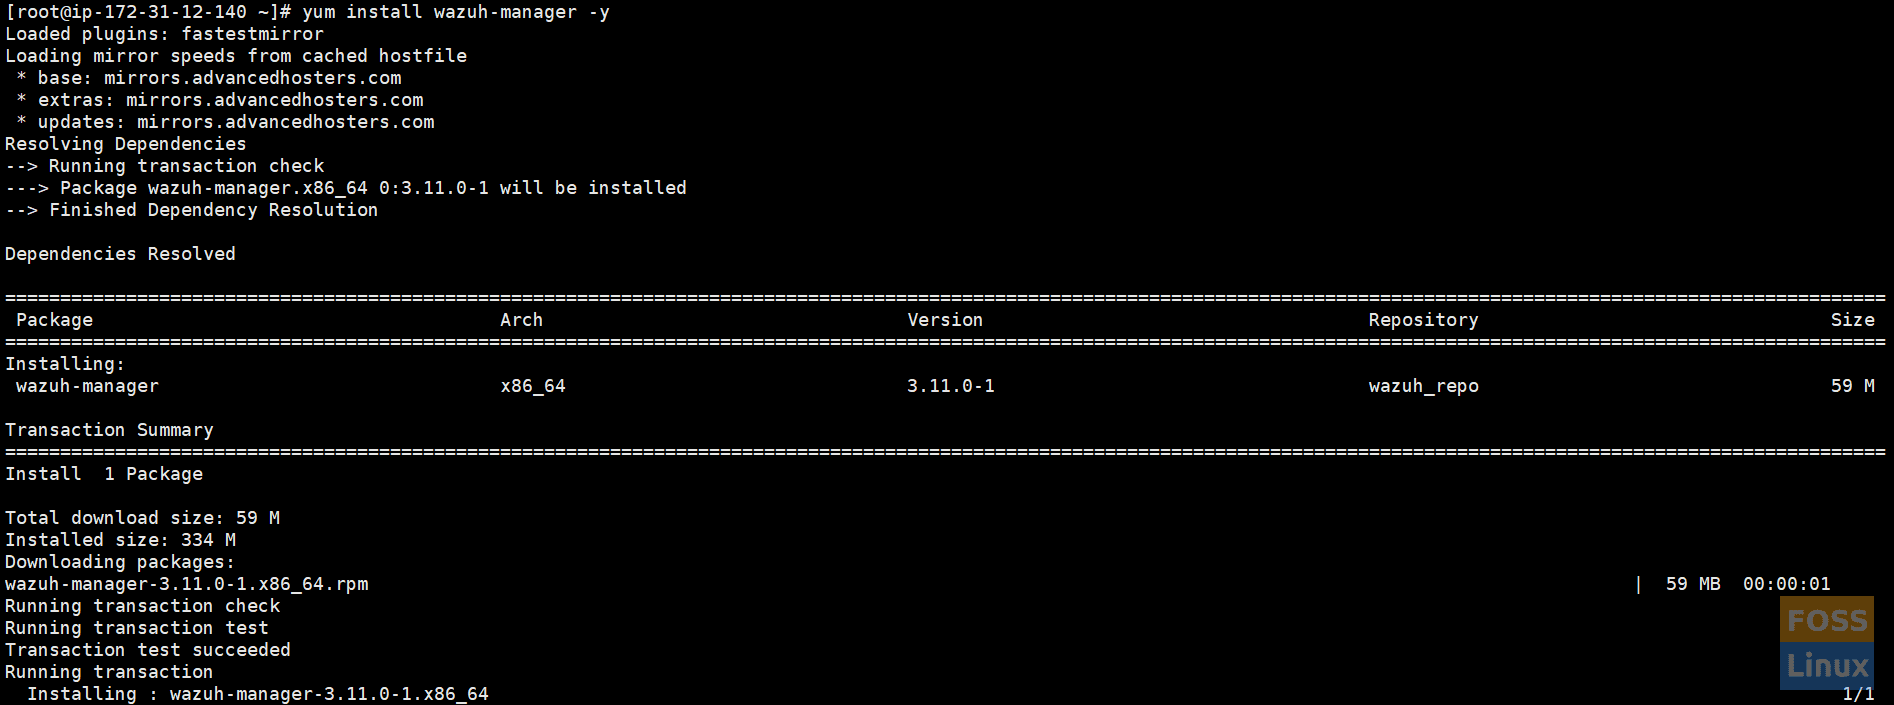
Then, install Wazuh Manager, and check the status of it.
systemctl status wazuh-manager
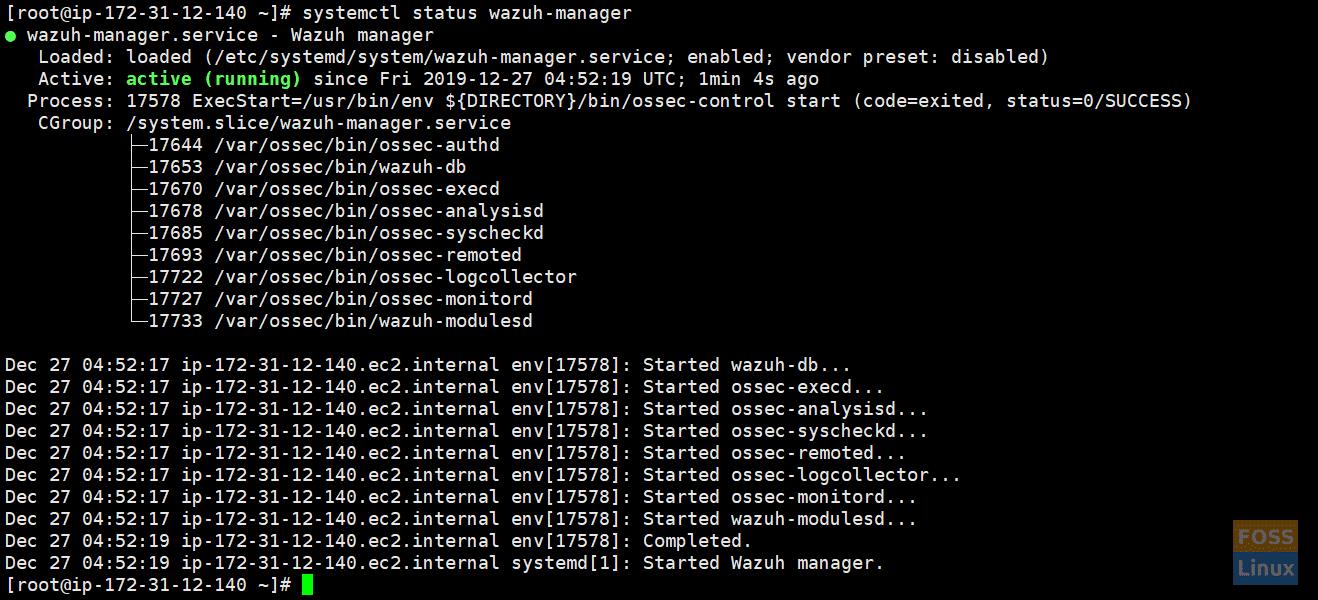
Check Status
Installing the Wazuh API
NodeJS >= 4.6.1 is required to run the Wazuh API.
Add the official NodeJS repository:
curl --silent --location https://rpm.nodesource.com/setup_8.x | bash -
install NodeJS:
yum install nodejs -y
Install the Wazuh API. It will update NodeJS if it is required:
yum install wazuh-api

Install Wazuh API
Check the status of wazuh-api.
systemctl status wazuh-api
Change the default credentials manually using the following commands:
cd /var/ossec/api/configuration/auth
Set a password for the user.
node htpasswd -Bc -C 10 user darshana
Restart API.
systemctl restart wazuh-api
If you need it, you can change the port manually. The file /var/ossec/api/configuration/config.js contains the parameter:
// TCP Port used by the API.
config.port = "55000";
We are not changing the default port.
Installing Filebeat
Filebeat is the tool on the Wazuh server that securely forwards alerts and archived events to Elasticsearch. To install it, run the following command:
rpm --import https://packages.elastic.co/GPG-KEY-elasticsearch
Setup repository:
vim /etc/yum.repos.d/elastic.repo
Add the following contents to the server:
[elasticsearch-7.x]
name=Elasticsearch repository for 7.x packages
baseurl=https://artifacts.elastic.co/packages/7.x/yum
gpgcheck=1
gpgkey=https://artifacts.elastic.co/GPG-KEY-elasticsearch
enabled=1
autorefresh=1
type=rpm-md
Install Filebeat:
yum install filebeat-7.5.1
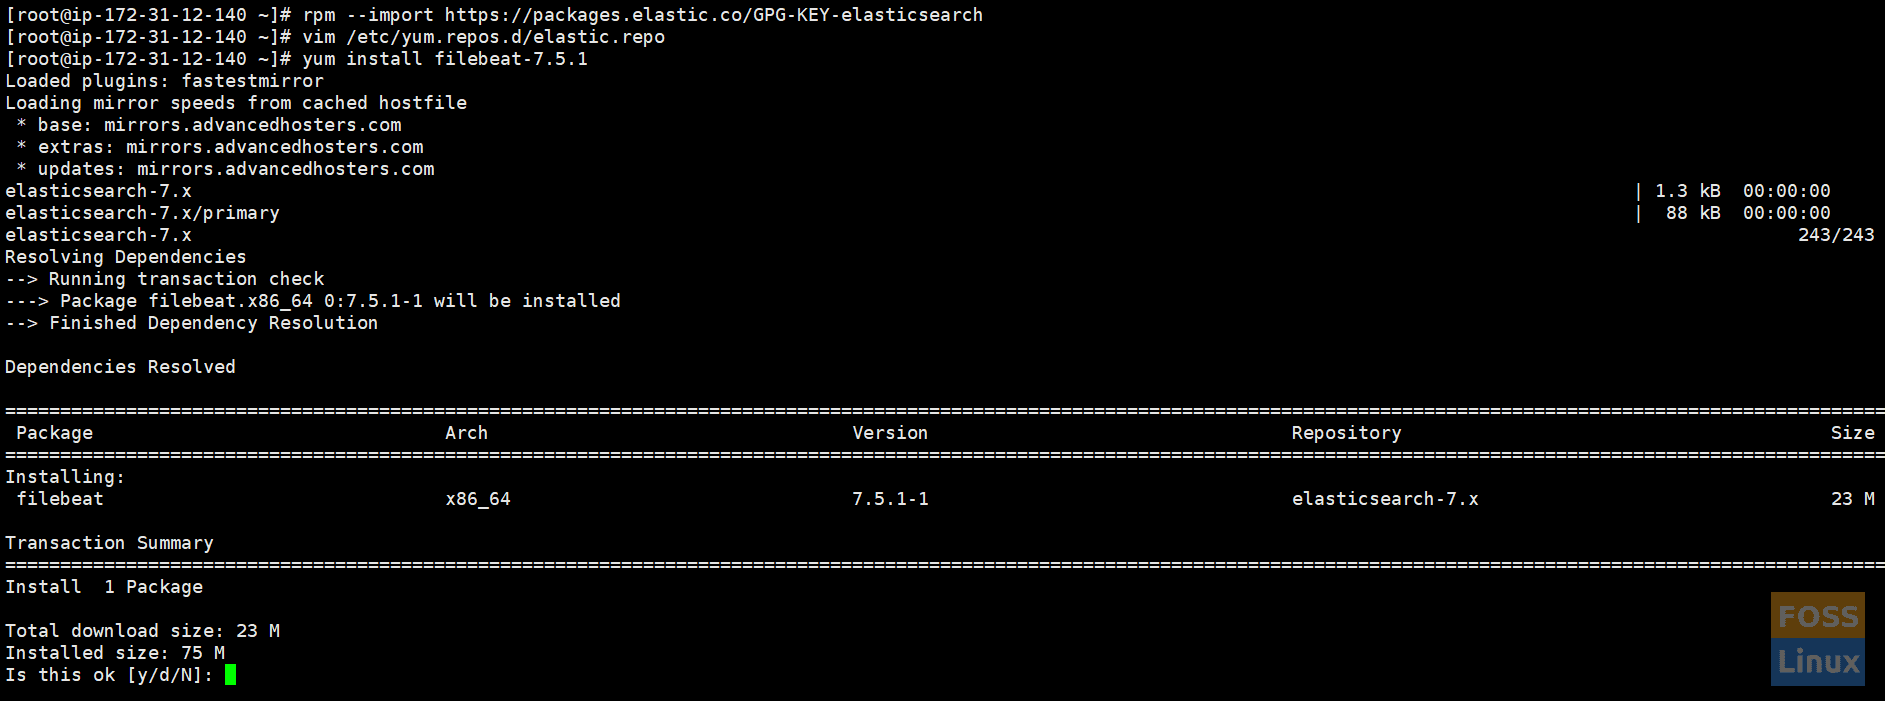
Install Filebeat
Download the Filebeat configuration file from the Wazuh repository. This is pre-configured to forward Wazuh alerts to Elasticsearch:
curl -so /etc/filebeat/filebeat.yml https://raw.githubusercontent.com/wazuh/wazuh/v3.11.0/extensions/filebeat/7.x/filebeat.yml
Change file Permissions:
chmod go+r /etc/filebeat/filebeat.yml
Download the alerts template for Elasticsearch:
curl -so /etc/filebeat/wazuh-template.json https://raw.githubusercontent.com/wazuh/wazuh/v3.11.0/extensions/elasticsearch/7.x/wazuh-template.json
chmod go+r /etc/filebeat/wazuh-template.json
Download the Wazuh module for Filebeat:
curl -s https://packages.wazuh.com/3.x/filebeat/wazuh-filebeat-0.1.tar.gz | sudo tar -xvz -C /usr/share/filebeat/module
Add Elasticsearch server IP. Edit “filebeat.yml.”
vim /etc/filebeat/filebeat.yml
Modify the following line.
output.elasticsearch.hosts: ['http://ELASTIC_SERVER_IP:9200']
Enable and start the Filebeat service:
systemctl daemon-reload
systemctl enable filebeat.service
systemctl start filebeat.service
2. Installing Elastic Stack
Now we are going configure second Centos server with ELK.
Do the configurations on your elastic stack server.
Preconfigurations
As usual, let’s set-hostname first.
hostnamectl set-hostname elk
Update the system:
yum update -y
Installing ELK
Install Elastic Stack with RPM packages and then add the Elastic repository and its GPG key:
rpm --import https://packages.elastic.co/GPG-KEY-elasticsearch
Create a repository file:
vim /etc/yum.repos.d/elastic.repo
Add the following content to the file:
[elasticsearch-7.x]
name=Elasticsearch repository for 7.x packages
baseurl=https://artifacts.elastic.co/packages/7.x/yum
gpgcheck=1
gpgkey=https://artifacts.elastic.co/GPG-KEY-elasticsearch
enabled=1
autorefresh=1
type=rpm-md
Installing Elasticsearch
Install the Elasticsearch package:
yum install elasticsearch-7.5.1
Elasticsearch listens by default on the loopback interface (localhost). Configure Elasticsearch to listen to a non-loopback address by editing /etc / elasticsearch / elasticsearch.yml and uncommenting network.host configuration. Adjust the IP value you want to connect to:
network.host: 0.0.0.0
Change firewall rules.
firewall-cmd --permanent --zone=public --add-rich-rule='
rule family="ipv4"
source address="34.232.210.23/32"
port protocol="tcp" port="9200" accept'
Reload firewall rules:
firewall-cmd --reload
The further configuration will be necessary for the elastic search configuration file.
Edit the “elasticsearch.yml” file.
vim /etc/elasticsearch/elasticsearch.yml
Change or edit “node.name” and “cluster.initial_master_nodes”.
node.name: <node_name>
cluster.initial_master_nodes: ["<node_name>"]
Enable and start the Elasticsearch service:
systemctl daemon-reload
Enable on system boot.
systemctl enable elasticsearch.service
Start elastic search service.
systemctl start elasticsearch.service
Check the status of the elastic search.
systemctl status elasticsearch.service
Check the log file for any issues.
tail -f /var/log/elasticsearch/elasticsearch.log
Once Elasticsearch is up and running, we need to load the Filebeat template. Run the following command on the Wazuh server (We installed filebeat there.)
filebeat setup --index-management -E setup.template.json.enabled=false
Installing Kibana
Install the Kibana package:
yum install kibana-7.5.1
Install the Wazuh app plugin for Kibana:
sudo -u kibana /usr/share/kibana/bin/kibana-plugin install https://packages.wazuh.com/wazuhapp/wazuhapp-3.11.0_7.5.1.zip

Kibana PluginNeed to modify Kibana configurations to access Kibana from the outside.
Edit the Kibana configuration file.
vim /etc/kibana/kibana.yml
Change the following line.
server.host: "0.0.0.0"
Configure the URLs of the Elasticsearch instances.
elasticsearch.hosts: ["http://localhost:9200"]
Enable and start the Kibana service:
systemctl daemon-reload
systemctl enable kibana.service
systemctl start kibana.service
Adding Wazuh API to Kibana Configurations
Edit “wazuh.yml.”
vim /usr/share/kibana/plugins/wazuh/wazuh.yml
Edit hostname, username, and password:
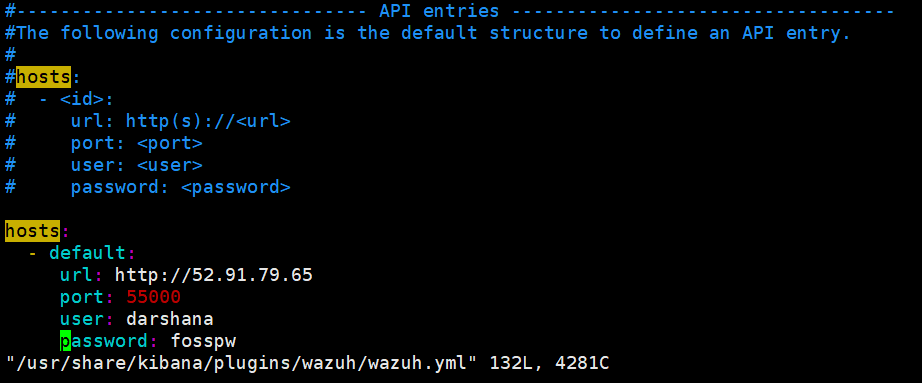
Kibana_Wazuh_Api
Save and exit the file and restart the Kibana service.
systemctl restart kibana.service
We installed the Wazuh server and the ELK server. Now we are going to add hosts using an agent.
3. Installing Wazuh agent
I. Adding Ubuntu Server
a. Installing needed packages
apt-get install curl apt-transport-https lsb-release gnupg2
Install the Wazuh repository GPG key:
curl -s https://packages.wazuh.com/key/GPG-KEY-WAZUH | apt-key add -
Add the repository and then update repositories.
echo "deb https://packages.wazuh.com/3.x/apt/ stable main" | tee /etc/apt/sources.list.d/wazuh.list
apt-get update
b. Installing the Wazuh agent
Blow command adds “WAZUH_MANAGER” IP to wazuh-agent configuration automatically when installing it.
WAZUH_MANAGER="52.91.79.65" apt-get install wazuh-agent
II. Adding CentOS host
Add the Wazuh repository.
rpm --import http://packages.wazuh.com/key/GPG-KEY-WAZUH
Edit and add to the repository:
vim /etc/yum.repos.d/wazuh.repo
Add the following contents:
[wazuh_repo]
gpgcheck=1
gpgkey=https://packages.wazuh.com/key/GPG-KEY-WAZUH
enabled=1
name=Wazuh repository
baseurl=https://packages.wazuh.com/3.x/yum/
protect=1
Install the agent.
WAZUH_MANAGER="52.91.79.65" yum install wazuh-agent
4. Accessing Wazuh Dashboard
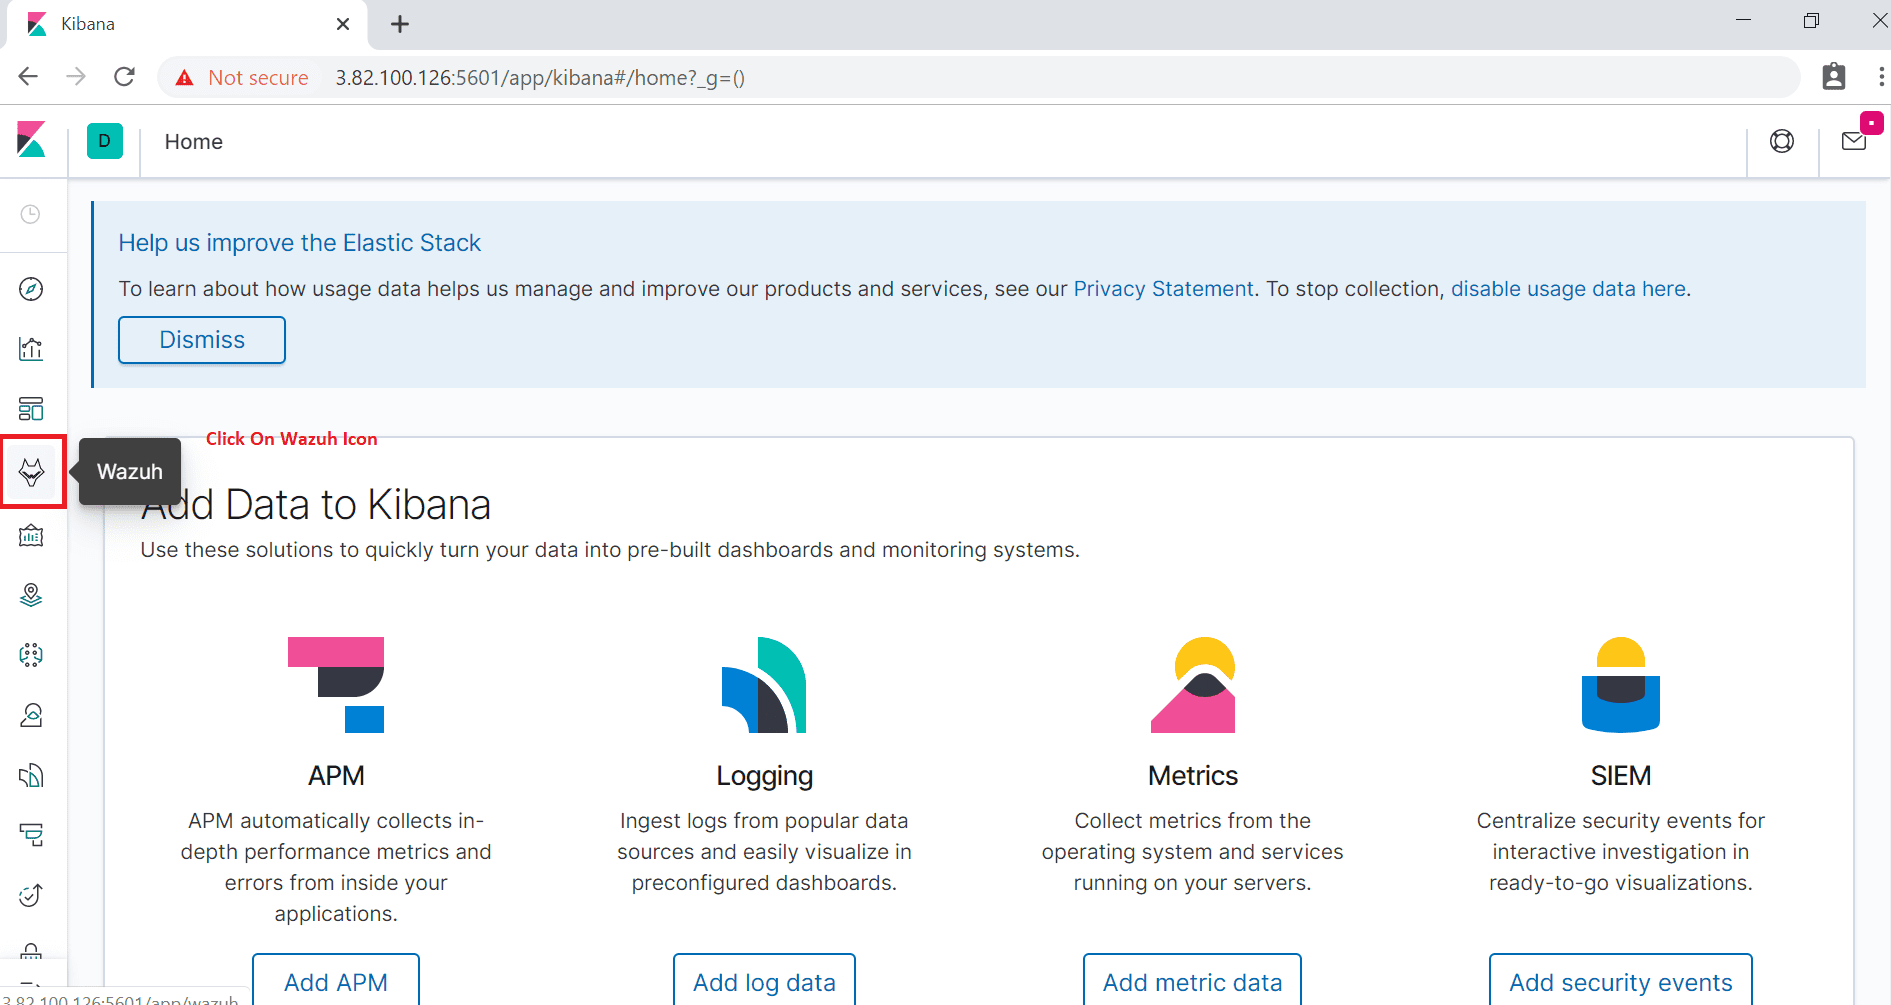
Browse Kibana using the IP.
http://IP or hostname:5601/
You will see the below interface.
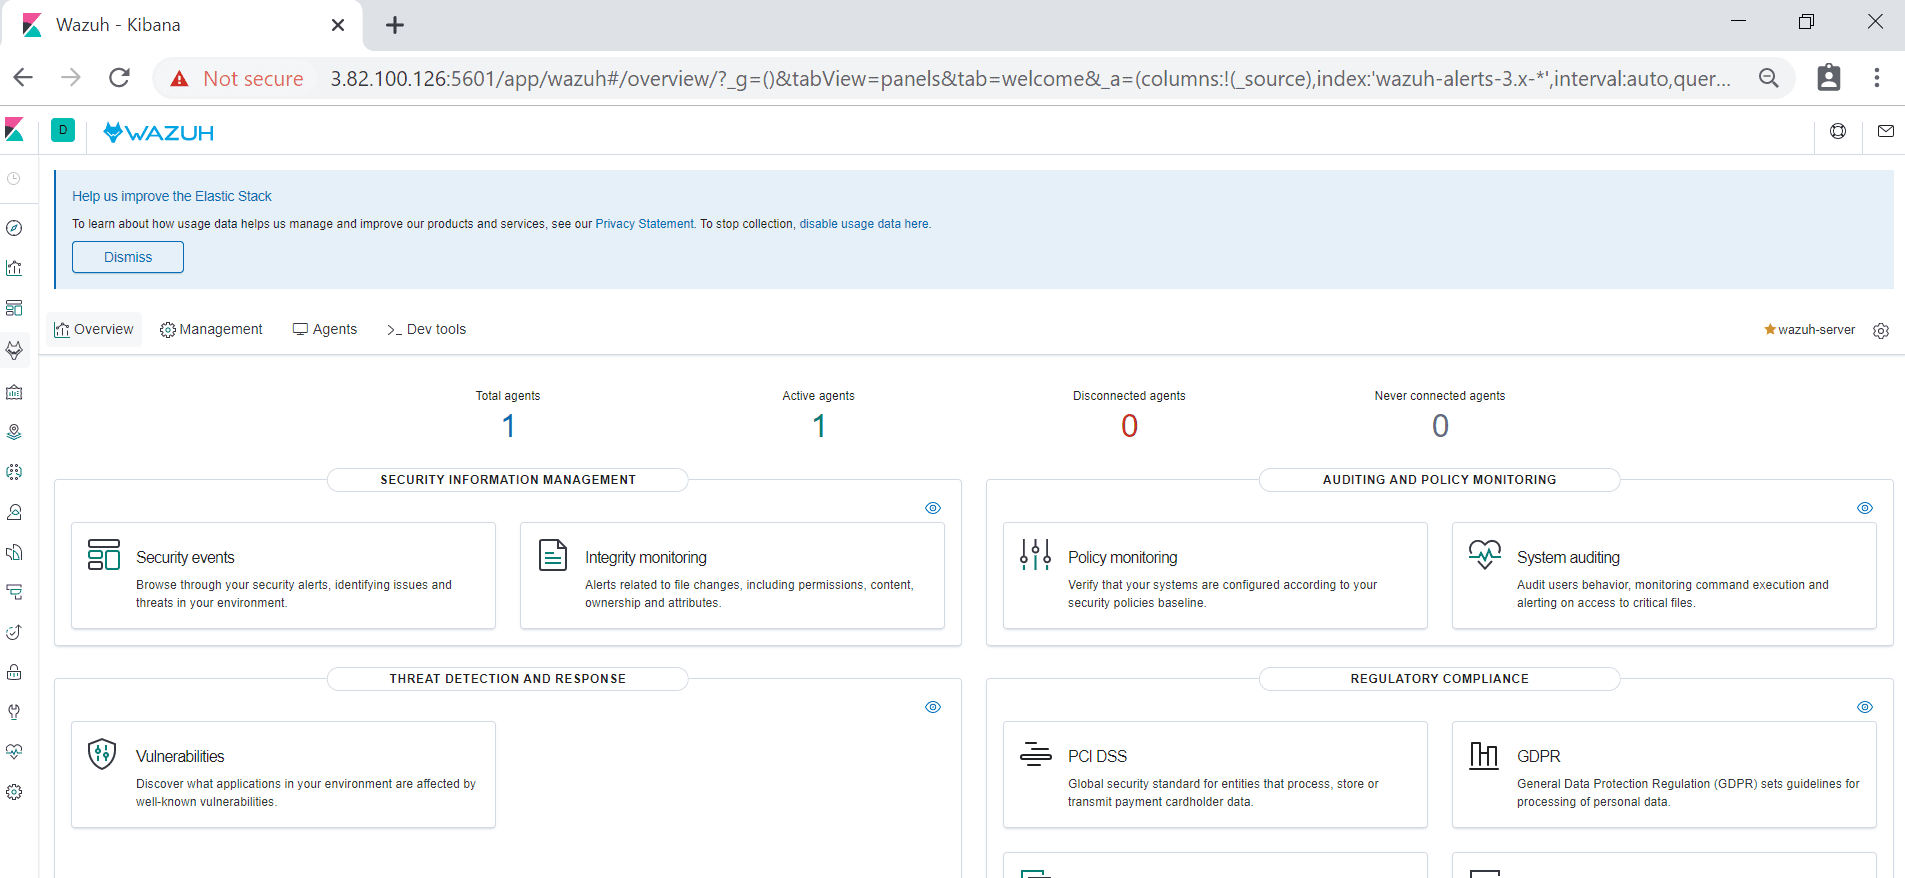
Then click on “Wazuh ” Icon to go to its Dashboard. You will see “Wazuh” Dashboard as follows.
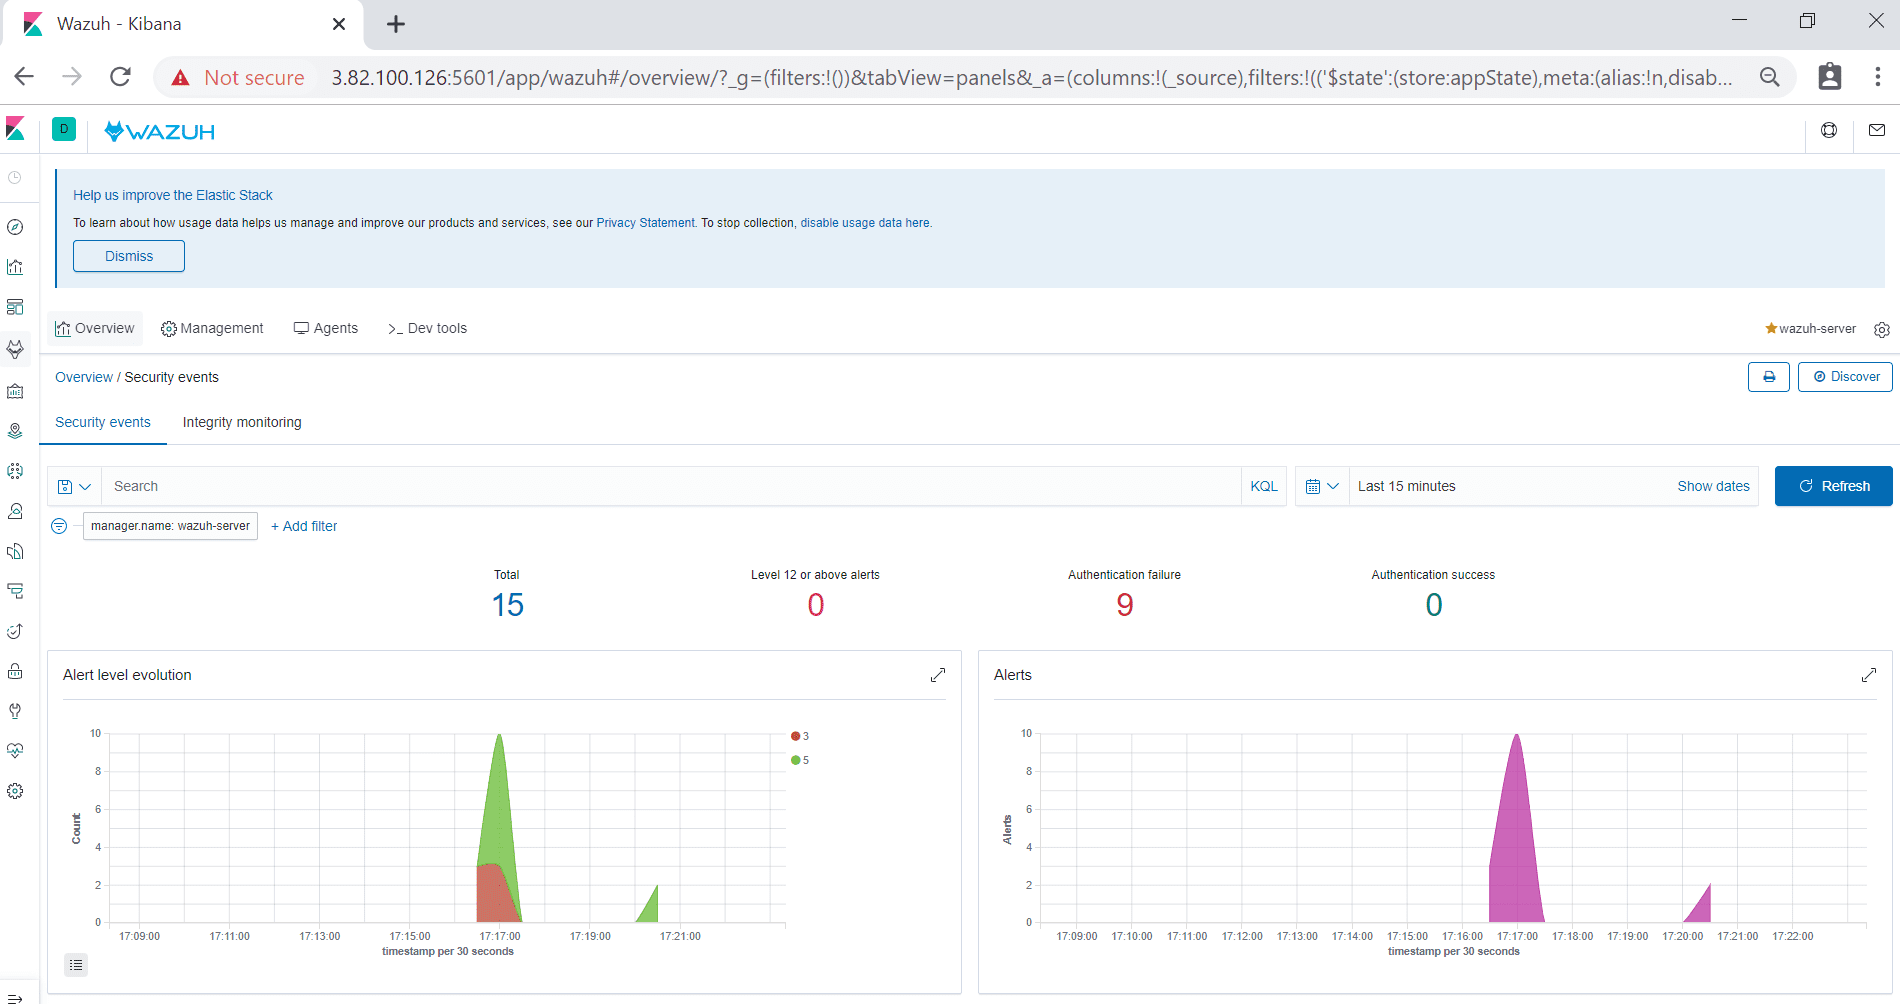
Here you can see connected agents, security information management, etc.. when you click on security events; you can see a graphical view of events.
If you reached this far, congrats! That’s all about installing and configuring the Wazuh server on CentOS.


3 comments
Hi Darshana,
I would like to install the Wazuh Manager on public IP and add agents in LAN from different locations through internet. Is it possible?
Hi Barani,
Yes, it is possible and given that Wazuh uses industry-grade encryption it is built to safely transmit data over LAN.
It will be necessary to make open the manager’s port 1514 available to the LAN for TCP traffic.
Opening port 1515 will allow you to automatically enroll agents and you may open other ports for convenience like 413 (for the web interface) and 55000 (for the Wazuh API).
Hi
I have installed wazuh and trying to capture Palo Alto config logs but wazuh server not capturing config syslog messages traffic logs are receiving but only Config and system logs are receiving
Could you please help me ?