
The Linux command Netstat (Network Statistics) is used to display the different information of the network. That includes network connections, routing tables, masquerade connections, interface statistics, multicast membership, and so on. This command is handy and important for Linux network administrators to handle the network-related problems, troubleshoot and monitor the network issues, and determine the performance of network traffic.
Note: In new updates of Linux, the ss command replaced the netstat command. This command is more powerful and can show more network connection information than the netstat command. We shall deal with the ss command later, but for now, let’s understand the usage of the still useful netstat command.
Netstat Command with examples
1. Display all the listening ports of TCP and UDP connections
To display the listening and non-listening sockets of network use -a -all option with netstat. Also, you can display the interfaces that are not up using -interface option.
# netstat -a | more
Example:
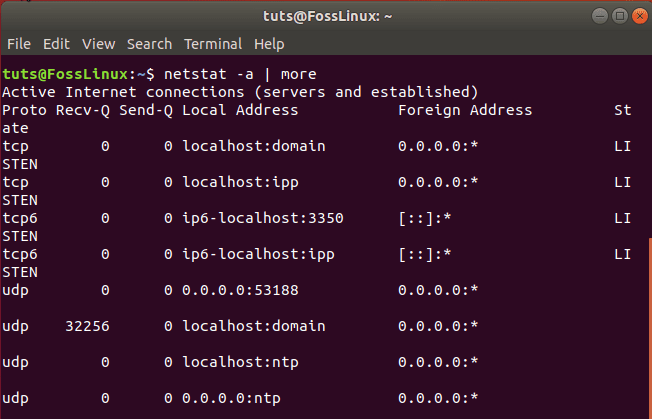
Display all TCP UDP listening ports
2. List all TCP ports connections:
To display only the TCP port connections, use the below command:
# netstat -at
Example:
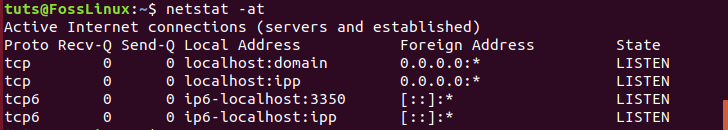
Display TCP ports
3. List all UDP port connections
To display only the UDP port connections, use the following command:
# netstat -au
Example:
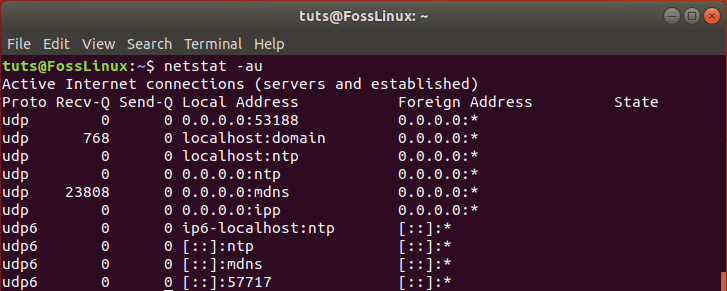
Display all UDP ports
4. Display all listening ports
To show only the active listening port connections use the ‘l’ operator.
# netstat -l
Example:
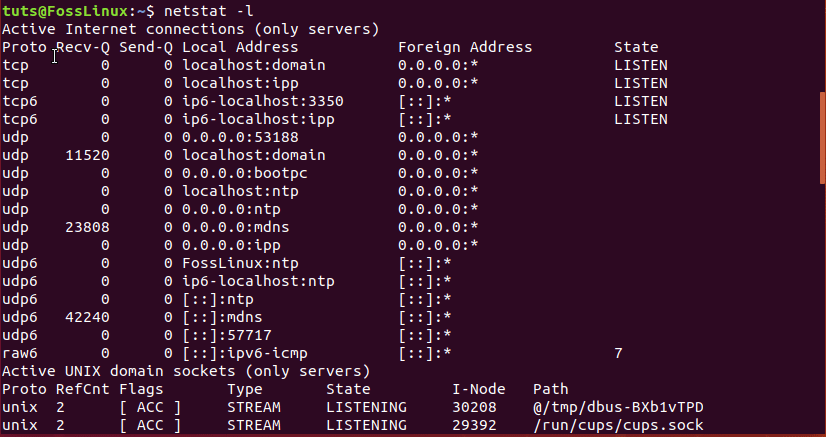
Display only listening connections
5. Display TCP listening ports
Similarly, the “lt” operator shows only the active listening TCP port connections.
# netstat -lt
Example:
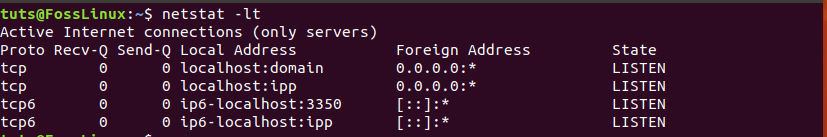
Display TCP listening ports
6. Display UDP listening ports
Another handy option to retrieve only the active listening UDP port connections. It can be done using the below command:
# netstat -lu
Example:
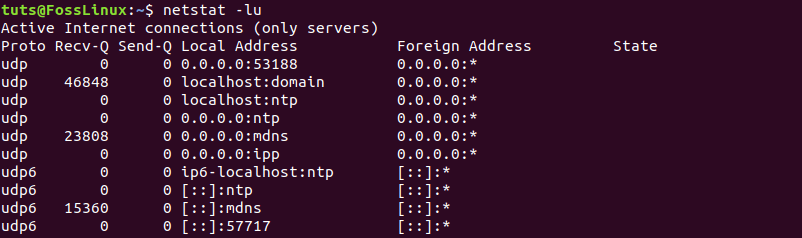
Display UDP listening ports
7. List all listening ports of UNIX
The active listening UNIX port connections can be obtained by using the “lx” operator.
# netstat -lx
Example:
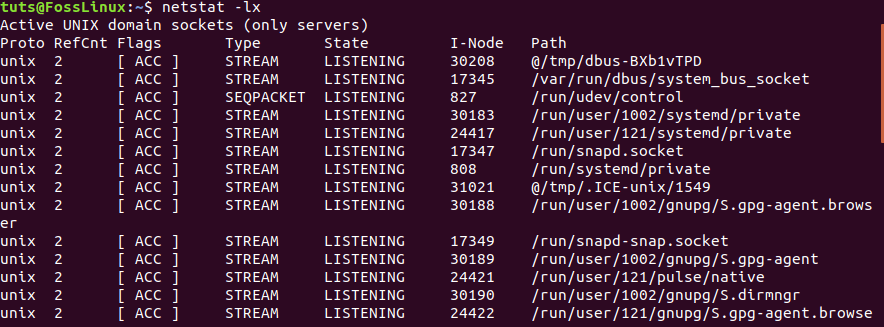
Display all UNIX listening ports
8. Display statistics By Protocols
To display the statistics of all the protocols TCP, UDP, ICMP, and IP, use the below command:
# netstat -s
Example:
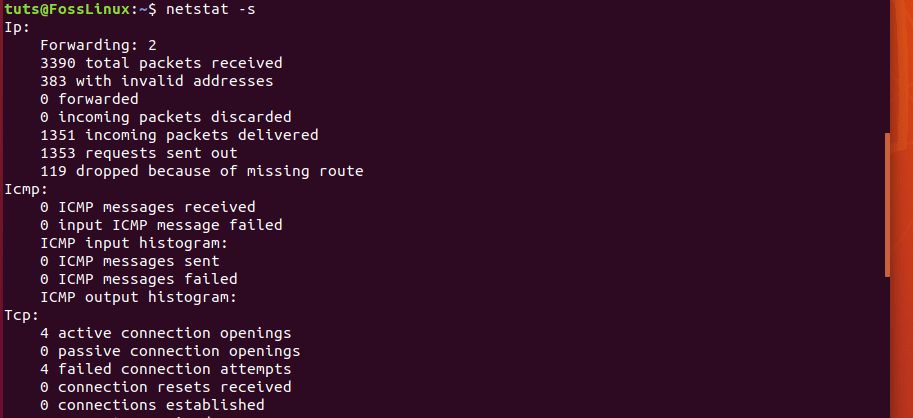
Display statistics for all protocols
9. Display statistics By TCP Protocols
To show the statistics of the TCP protocol, use the following command:
# netstat -st
Example:
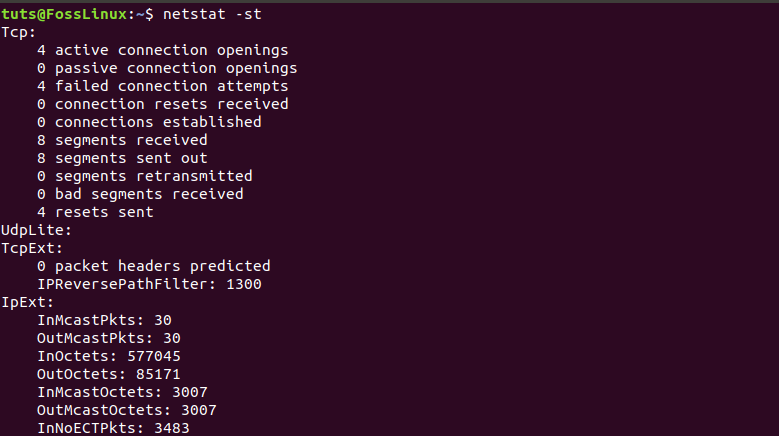
Display statistics for TCP protocol
10. Display statistics By UDP Protocols
To show the statistics of the UDP protocol, use the “su” command:
# netstat -su
Example:

Display statistics for TCP protocol
11. Displaying Service name with Process ID
For displaying the program name with PID, use netstat command with -tp option, which shows the ‘PID/Program Name.’
# netstat -tp
Example:
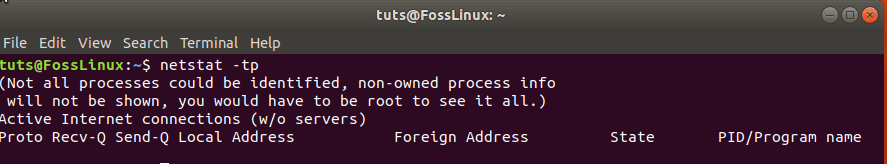
Displaying service name with process id
12. Continuously print the netstat information
The following command continuously prints the netstat information every few seconds.
# netstat -c
13. Display Kernel IP routing
Get the Kernel IP routing table information using the following command:
# netstat -r
Example:
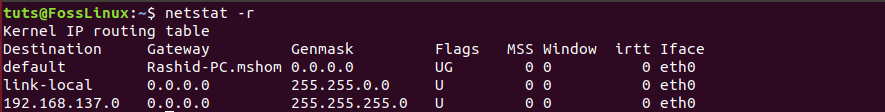
Display Kernel IP Routing Table
14. Display Network Interface Transactions
Retrieve the network interface transactions information using -i:
# netstat -i
Example:
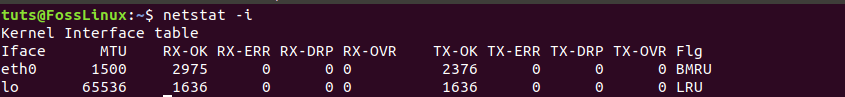
Display network interface transactions
15. Display Kernel Interface Table
To show the Kernel interface table similar to ifconfig, use ie:
# netstat -ie
Example:
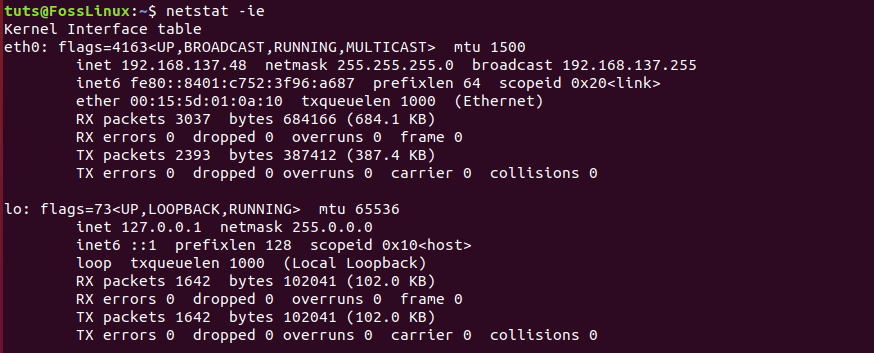
Display kernel interface table
16. Display IPv4 and IPv6 Information
To get the group membership information for both IPv4 and IPv6, use the below command.
# netstat -g
Example:
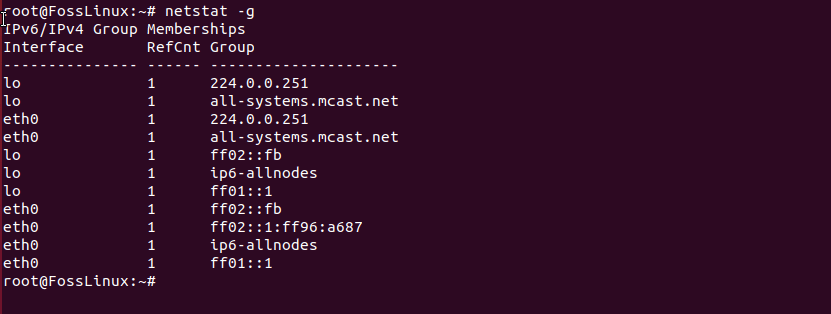
Display ipv4 and ipv6 info
17. Display Non-Supportive Address
To populate the non-supportive address, families with important information use the verbose command.
# netstat --verbose
Example:
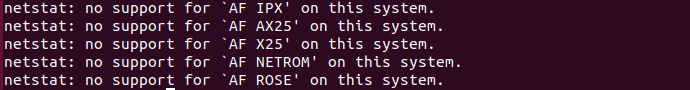
Display non-supportive address
18. Find Listening Programs
To find and display listening programs on a port, use the grep along with ap.
# netstat -ap | grep http
Example:
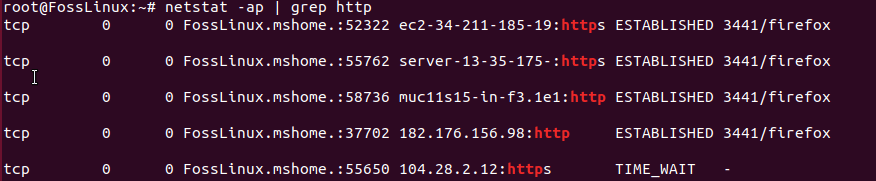
Display Listening Programs
19. Display RAW Network Statistics
To gather the raw network statistics, use the ap along with the grep function.
# netstat -ap | grep http
Example:

Display raw statistics
Conclusion
That’s the top examples of the netstat command used for networking. If you are looking for more information and options about, fire up the man netstat command in the terminal to get all the information.
1 comment
Nice work!
Minor glitch: It appears that item 19 repeats the string from 18. Clearly the screen shot is different.