Diagrams and flowcharts help designers or teams communicate relationships, present abstract ideas in brainstorming sessions, visualize concepts, or formalize a new project. The open-source community provides various diagramming tools to help you create basic workflow diagrams, complex network diagrams, organization charts, ERD diagrams, UML diagrams, and much more.
Diagramming tools for Linux
This article reviews the best open-source flowcharts and diagramming software to create different diagrams, flowcharts, illustrations, maps, web graphics, and much more. If you are working on photos, check our comprehensive guide on the best photo editors.
1. Dia
Dia is a free, open-source, and cross-platform drawing software. It features a simple interface and a wide variety of predefined objects and symbols. It works well with simple to complex diagrams, and you can create more than 30 different diagram types such as flowcharts, network layouts, database models.
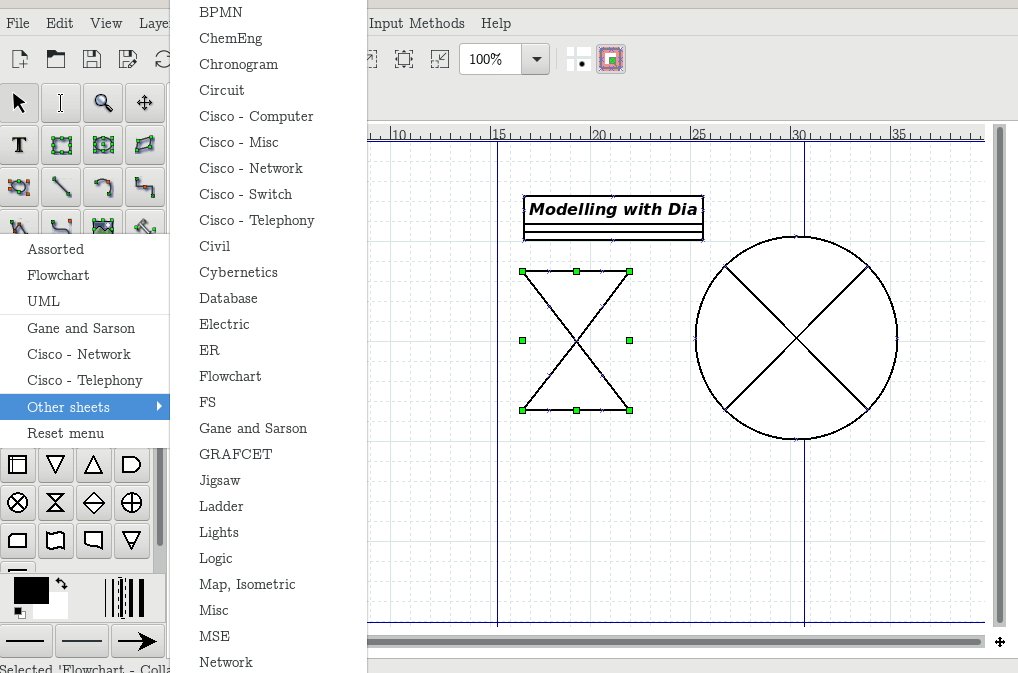
Dia diagram editor
Important features
- It comes with a shape repository for custom objects and symbols to get you started on a diagram.
- Features a wide range of styling and formatting tools.
- User-friendly interface.
- It features diagramming tools similar to Microsoft Visio, such as special objects, layers, gridlines, etc.
- Dia is scriptable via Python, and developers can use it as a computer-aided software engineering tool.
- Make code skeletons from drawings.
- You can use it via the command line.
Dia can get you started on diagrams quickly! Moreover, it launches ready-to-work with a multipage drawing that can come in handy if you create large charts.
Install on Fedora 33
# dnf install dia
2. LibreOffice Draw
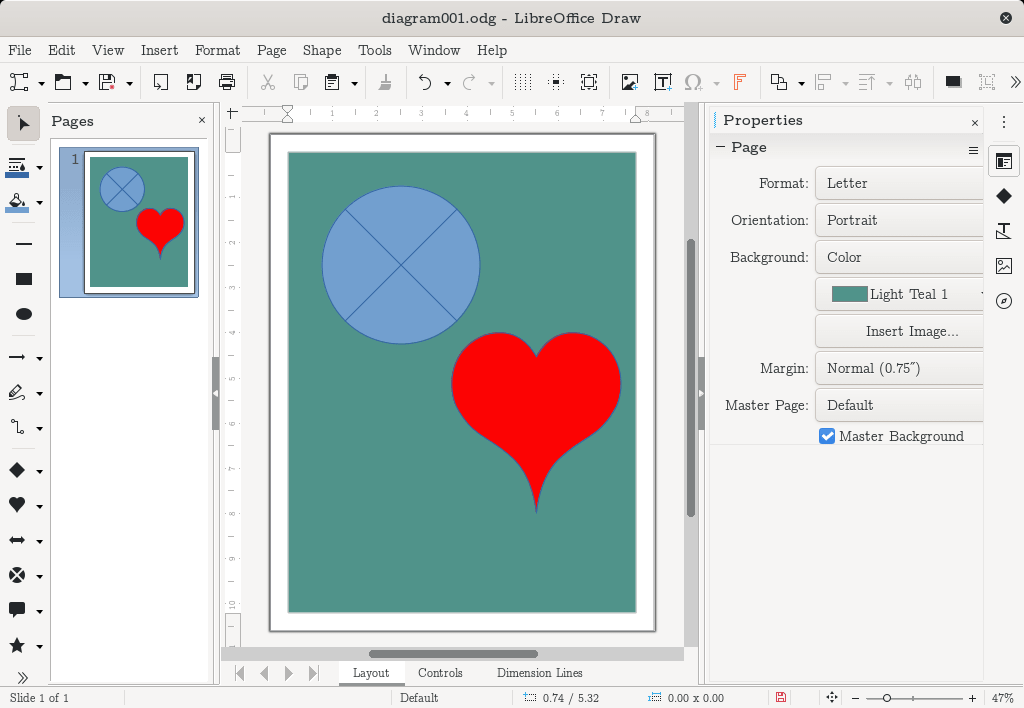
LibreOffice Draw
LibreOffice Draw is part of the LibreOffice suite and features an easy-to-use UX, especially for users familiar with OpenOffice draw or LibreOffice Writer. You can produce powerful and intuitive flowcharts, organization charts, brochures, posters, network diagrams, and many other types of graphics. Its Open Document Format for Office Applications (ODF) and (.odg graphics extension) is also compatible with macOS and windows.
Important features
- It features a gallery of shapes, drawings.
- Import from a wide range of file formats like PDF and export to GIF, JPEG, PNG, SVG, WMF, and more.
- It features predefined flowchart shapes, styles, & formatting tools to make posters and brochures.
- It supports macro execution with Java.
- Users can benefit from the extensive help facility from the help menu and extensive online resources.
Follow these instructions on to Install LibreOffice on Fedora.
3. OpenOffice Draw
OpenOffice draw is part of the OpenOffice suite project as a tool for drawing business processes and diagrams. If you are familiar with LibreOffice draw, then you will find it an easy-to-use tool. It supports different diagram types such as flowcharts, organization charts, network diagrams, and so on.
Important features
- It supports various styles and formatting.
- It features a 3D controller to create shapes quickly.
- Import from several file formats like PDF and export to GIF, JPEG, PNG, BMP, SVG, WMF, and more.
- Supports creation of flash (.swf) versions of your work.
OpenOffice and LibreOffice Draw are similar tools that provide good flowchart capability with extensive resources and easy-to-use interfaces. The performance is also pretty good, and other standard LibreOffice writing tools, such as spell check, are also a plus.
4. Inkscape
Inkscape is more than just a flowchart or diagramming tool. You can use vector graphics software to create various graphics such as flowcharts, icons, illustrations, maps, diagrams, and web graphics.
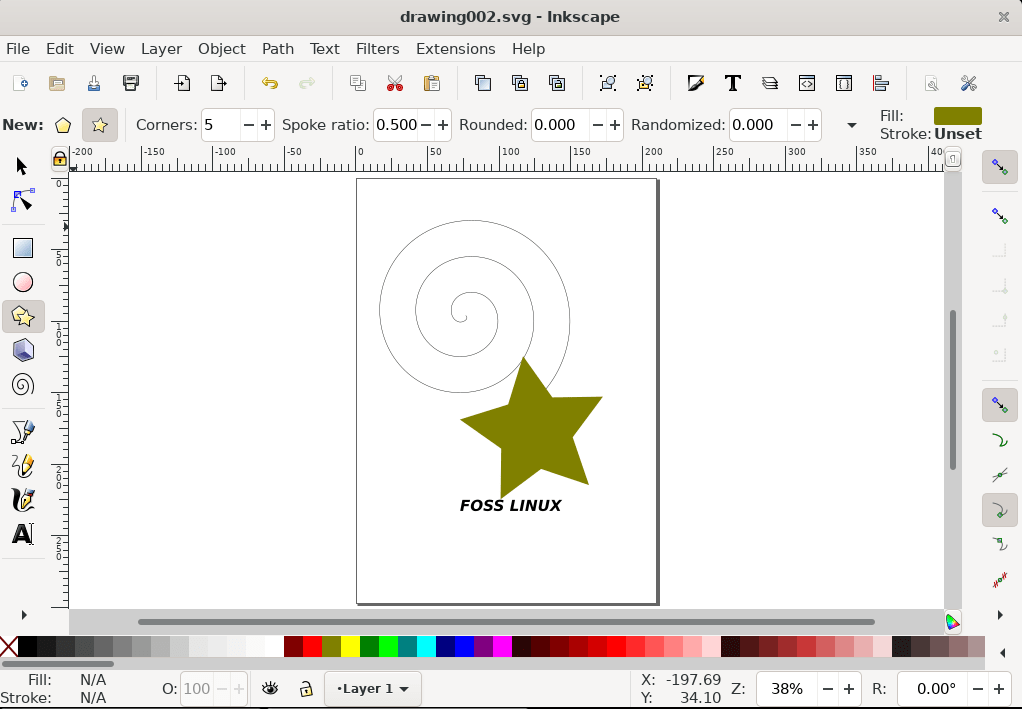
Inkscape
Important features
- You can import and export to various file formats such as SVG, AI, EPS, PS, PDF, and PNG.
- Utilizes SVG (Scalable Vector Graphics) as its native format.
- It features object creation and manipulation, fills, and strokes.
- Highly customizable with add-ons to extend functionality.
- Supports auto shapes, design layers, and a 3D boxes tool.
- Functions as a sketch tool with sketch and trace.
- Multi-lingual.
If you like to work with vector graphics, then Inkscape is a tool worth giving a try. Its simple interface and toolbar items make it straightforward to create basic shapes like rectangles and squares, for starters.
Install as a snap
# snap install calligra --candidate
Fun Fact:
Vector graphics file extensions include: .SVG, .PDF, .AI.
Raster graphics file extensions include: .BMP, .TIF, .JPG, .GIF.
5. Calligra Flow
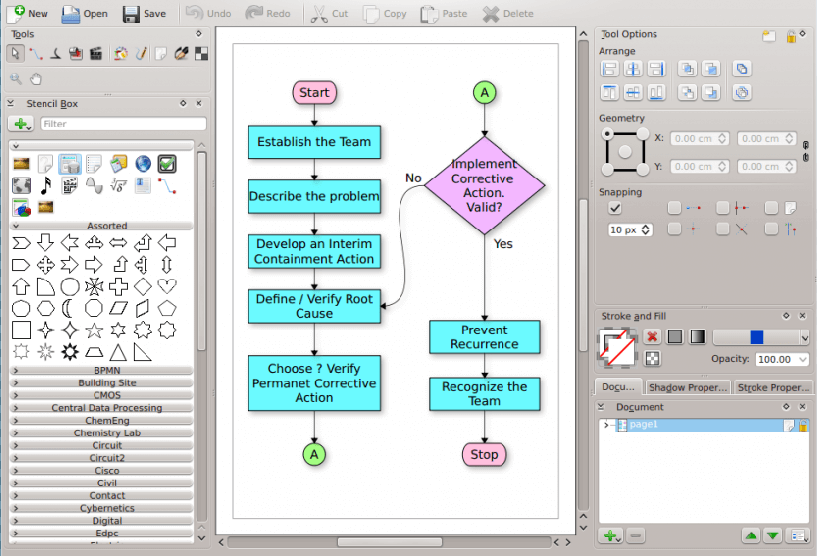
Calligra Flow
Calligra Flow is an easy-to-use tool that is included in the Calligra Office Suite project. Flow is the component of Calligra Office that allows flowcharts. Users can also work on 2D drawings, illustrations, create diagrams, network diagrams, organization charts, etc.
Important features
- Highly integrated with other Calligra applications in the Calligra Office Suite project.
- Extensive styling, formatting tools, and stencil boxes.
- Supports Vector Drawing.
- Visual Database App Creator.
- It features a presentation maker, document Creator, a calculation, and a Spreadsheet tool.
- Customizable dockers.
Calligra Flow is a tool geared towards flowcharts and could make a good choice, preferably for KDE users.
Install as a snap
# snap install calligra --candidate
6. Graphviz
Graph Visualization Software (Graphviz) is an open-source and programmable graph drawing software. You can utilize this tool to create network diagrams, database connections, bioinformatics, and similar diagrams.
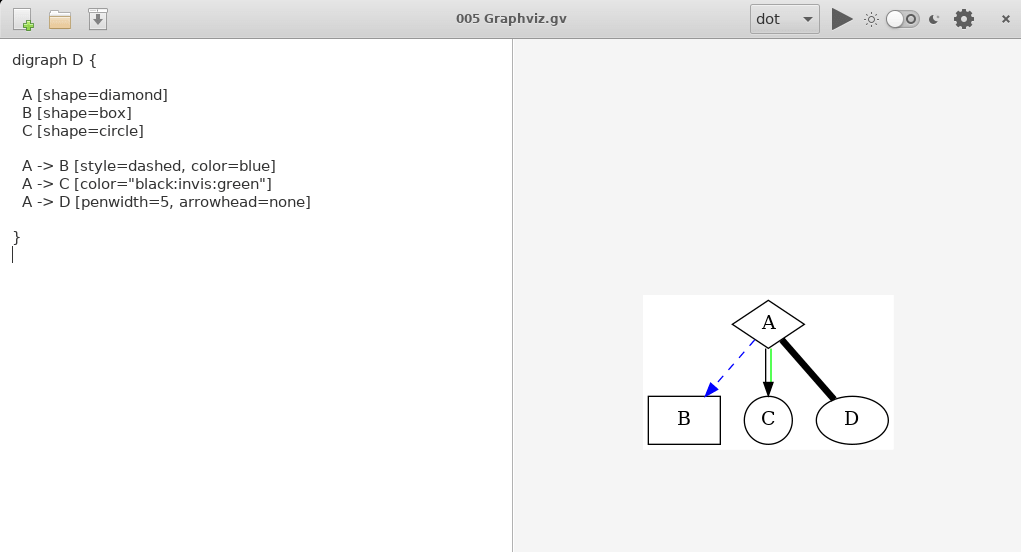
Graphviz
Important features
- It features a collection of programs for graph visualization specified in DOT language scripts.
- It features web and interactive graphical interfaces to display output.
- Supports a wide range of formats such as images and SVG for web pages, Postscript, or PDF for inclusion in other documents.
- Supports a wide range of colors, fonts, tabular node layouts, line styles, hyperlinks, and custom shapes.
Graphviz is a tool for users with projects to convert text to graphical representations, and you can get started from the official Graphviz documentation.
Install on Fedora 33
# dnf install Graphviz
7. Umbrello
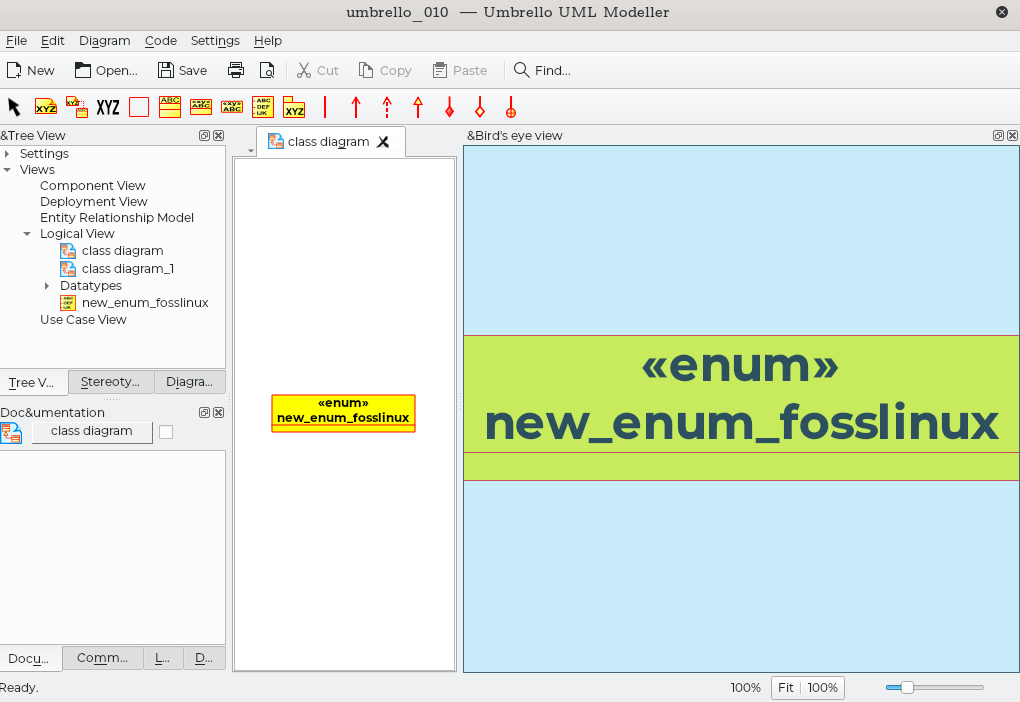
Umbrello
Umbrello UML Modeller is a free and open-source Unified Modelling Language (UML) diagram tool based on KDE. Designers can use it to create diagrams of software such a class diagram, sequence diagram, collaboration diagram, use case diagram, activity diagram, state diagram, component diagram, and entity relationship diagrams (ERDs)
Important features
- Users can generate code from UML diagrams in a variety of programming languages.
- Cross-platform.
- Create a wide variety of diagrams like class diagrams, sequence diagrams, component diagrams, and entity-relationship diagrams (ERDs), and much more.
Install as a snap
# snap install umbrello
8. yEd Graph Editor
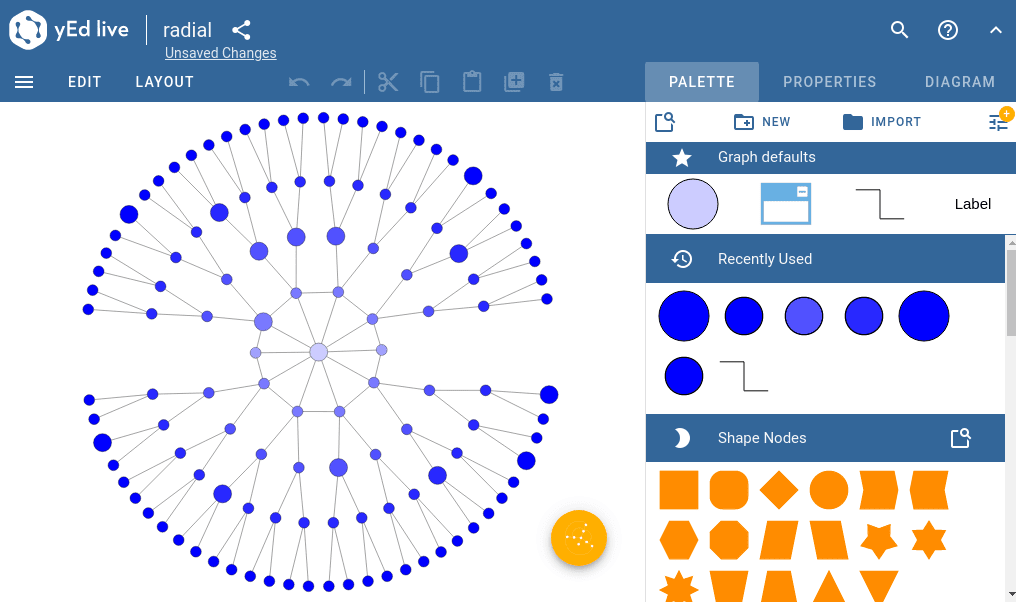
yED Graph Editor
yEd Graph Editor is a powerful cross-platform desktop application for creating diagrams. It supports various diagram types, and you can manually create diagrams or external import data for manipulation or analysis. It supports diagrams such as illustrated types, mind maps, organization charts, swimlane diagrams, ERDs.
Important Features
- Intuitive user interface.
- Import external data from an excel spreadsheet (.xls) or XML.
- Export bitmap and vector graphics such as PNG, JPG, SVG, PDF, and SWF.
- Drag and drop feature to make diagrams quickly.
- Wide range of automatic layout algorithms to arrange large data sets effectively.
- It supports the automatic arrangement of diagram elements.
- Accessible via yED live editor in a web browser.
9. Diagrams.net
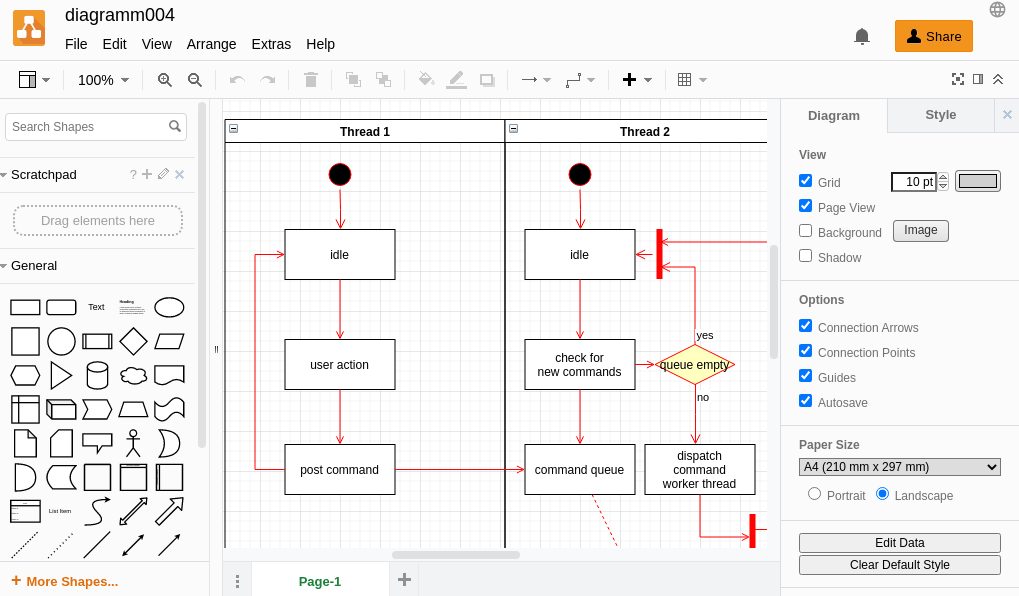
app.diagram.net
Diagrams.net is a free, open-source diagramming project that is primarily web-based. It features many powerful tools to create different diagrams such as flowcharts, E-R diagrams, and many more. It also supports drag and drop that can come in handy if you have to create charts quickly. It
Important features
- Works with tools such as Office 365 apps and Google workplace.
- It features a variety of styling, formatting tools, and predefined shapes.
- Drag and drop feature to make diagrams quickly.
- Features various predefined templates, including software, network, business objects, and Kubernetes-specific shapes for cloud infrastructure.
- Output files can be saved as simple text files, making backups and sharing incredibly straightforward.
- Supports direct uploads and integration to cloud storage.
If you find the project interesting, try the offline desktop version to enhance performance and privacy. Diagrams.net open-source project (formerly draw.io) is available with the Apache 2.0 license.
10. PlantUML
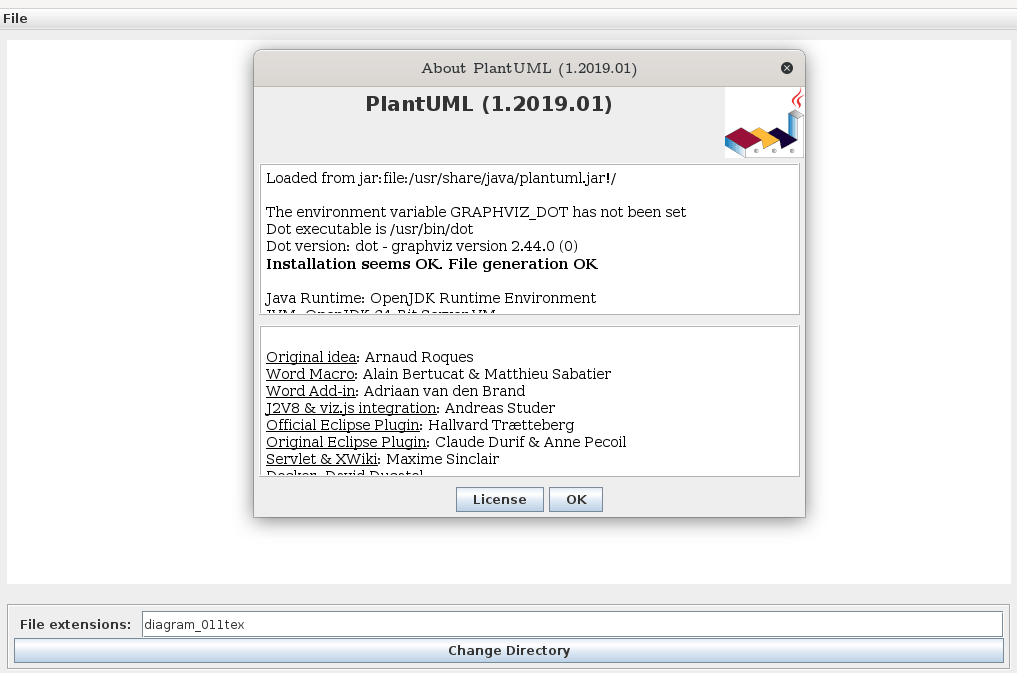
PlantUML
PlantUML is an exciting open-source tool for creating UML diagrams using a textual description language. It features an intuitive syntax used for modeling and can also be used with Emacs org-mode to develop technical documentation. Thus, it is a good choice if you seek to create professional-looking diagrams and technical designs.
Important features
- Create a wide range of diagrams such as class diagram, sequence diagram, collaboration diagram, deployment diagram, use case diagram, state diagram, activity diagram, component diagram, ER diagrams, etc.
- Create non-UML diagrams such as collaboration, sequence, use case, SDL, Gantt, and much more.
- Supports a variety of export formats such as PNG, SVG, or LaTex.
Install on Fedora 33
dnf install plantuml
11. Pencil
Pencil is an easy-to-use open-source GUI application for prototyping. It features built-in shapes, flowchart elements, desktop & web UI shapes, Android & iOS GUI shapes that make it a good choice for creating mockups and designing prototypes for desktop or mobile platforms.
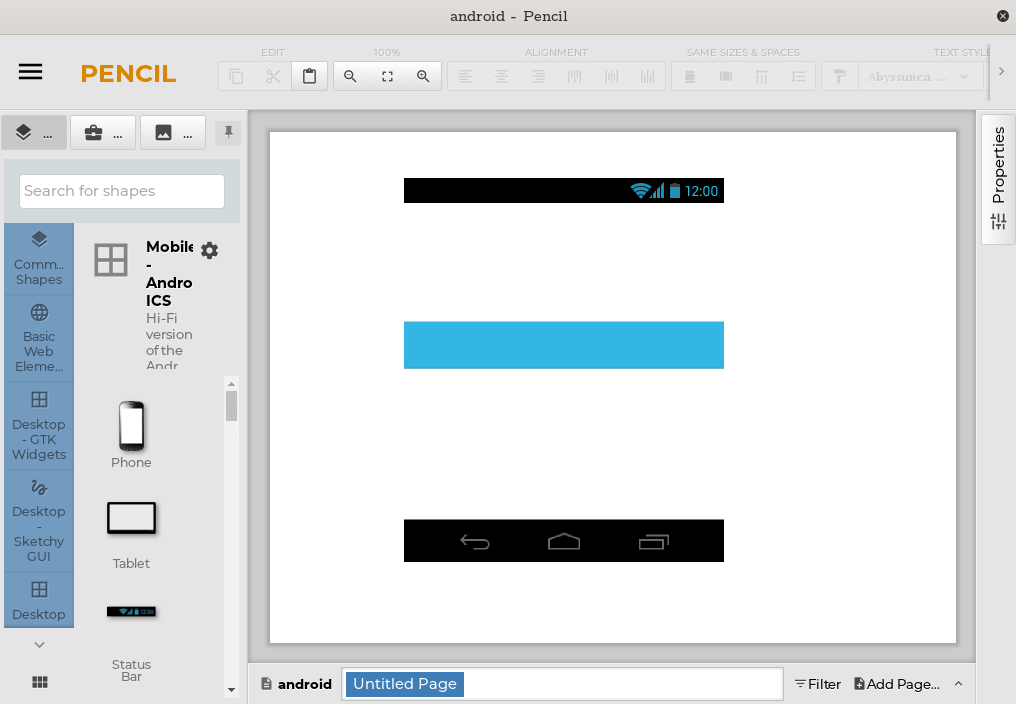
Pencil Android mockups
Important features
- It features a diagram drawing tool.
- It supports exporting to different formats, including ODT documents, SVG, and PDF.
- Integration with OpenClipart.org gives access to additional Cliparts.
- Cross-platform.
- Available as a Firefox extension.
Install as a snap
# snap install pencil-snap-demo
Conclusion
Whether you create flowcharts, UML, designing cloud infrastructure, web or application mockups, or network diagrams, images are a great way to share or communicate your ideas and vision to your team. The tools listed here will give you a great way to start designing diagrams and architecture that tell a story or communicate ideas effectively.
In my experience, Dia can offer a reliable experience for creating simple to intermediate diagrams, but my best experience in creating charts comes from Diagrams.net or yEd Graph editor. Both these tools provide an extensive list of extensions and built-in examples that can give you a quick way to get started on complex designs or diagrams with relative ease.

